Categories
Biden Pandemic COVID Reprints from others. Science

*YOU* can PROVE that COVID vaccines are killing people and should be immediately stopped

Visits: 37

BY Steve Kirsch Founder, Vaccine Safety Research Foundation (vacsafety.org) Updated 1/31/23

If the CDC was honest, this is what their new ads should look like!

If the CDC was honest, this is what their new ads should look like!

Using a novel analysis technique, anyone can now prove that there is no longer any doubt that the vaccines are SHORTENING the lifespans of EVERYONE who takes them. They should be immediately stopped.

Update at 12pm PST 1/31/23

This critique is convincing, but wrong. If everyone was last vaccinated just 10 days before the end of 2022, it would still be a .5 ratio if the vaccines were perfectly safe because the death rate in the final 10 days would be spread evenly over time.

I realized I made an error in some of the formulas so I’m re-doing the numbers.

Also, because the unvaxxed transition to the vaccinated, there are fewer unvaccinated to die in later months so there will be fewer unvaccinated deaths which will skew the ratio for the vaccinated to be lower than .5.

I’m currently using the date of last vaccination as the starting point and I believe it may be more correct to use the date of first vaccination. Still mulling that over.

Executive summary

This is the most important article I have ever written in my life.

It shows a novel method that anyone can use to prove that the COVID vaccines are leading to premature death in anyone who takes them, no matter what age. So you don’t have to believe me. You can collect the data yourself and do the same analysis I did. It’s very easy. It took me about an hour to collect the data and analyze it.

The methodology is both technically sound and objective. Anyone can collect their own data including any state in the US and many foreign governments. I predict no one will look. That tells you everything you need to know.

I asked UK Professor Norman Fenton to critique the method I used here. More about him in the text below. Bottom line: he loved the method I used (which he hadn’t seen before), he validated the calculations in the figure below, and he wasn’t aware of any way the conclusion could be legitimately challenged. There are always all sorts of hand-waving arguments such as “your study wasn’t IRB approved” or “your study is unethical because you are looking at deaths from the COVID vaccine” but they are just that: hand-waving.

To further prove my article cannot be challenged, I am pioneering a unique approach to that as well that is fair, thorough, and transparent. I’m publicly offering 10X your wager to anyone who believes that the data actually shows the opposite of what I claimed. See details of the offer in the text below. If you think I got it wrong, you can turn $25K into $250K in days!

This article describes how a simple objective analysis of objective death data (age, date died, date of last COVID vaccination) can be used to prove beyond a reasonable doubt that the COVID vaccines are shortening lifespans and should be immediately halted.

This explains why all the world’s health authorities are keeping their data secret; their data would reveal that all world governments have been killing millions of people worldwide. No government wants that disclosed. They won’t debate me on this. They will try to censor this article because they can’t hide from the truth. Or they will try to create FUD by arguing the survey is biased without describing the bias.

I predict that this article will be ignored by the mainstream press and the medical community. The longer they ignore me, the worse it will look for them. The first rule of holes is that when you find yourself in a hole, stop digging.

Unless there is a serious error in my methodology or someone can explain precisely how surveying “my followers” creates a biased sample that shifts the numbers for the vaccinated or shows us a more comprehensive, trustable data set, the game is now over.

If the vaccines are safe, the CDC should have produced this analysis using statewide data long ago. It is trivial to do. Why didn’t they? The answer is simple: because they know it would blow the narrative and prove to the world that they are incompetent fools.

If you want to prove me wrong, let’s get the statewide data from all states and make it public. All we need is Age, date of death, date of last COVID vaccine. That does not violate HIPAA or a dead person’s privacy because there is no PII.

But states will refuse to release that data because they know if they did, they are finished.

So in the meantime, they will say, “Your survey is biased.” But nobody can explain the “bias” that explains the result because my readers DO NOT CONTROL THE DATE THAT THEIR FRIENDS WERE VACCINATED, their age, or the DATE they died.

My readers may be more affluent than the average American so that’s a bias. But if the vaccine is killing affluent people, we have a problem. My readers might be more intelligent than the average American, so that’s a bias. They may have more intelligent friends. So this survey, it could be argued, just shows that intelligent people are being killed by the vaccine. That SHOULD be a stopping condition.

Or you could argue that my readers are less intelligent than the average person. And once again, unless you are trying to cull a society, that should be a stopping condition as unethical.

ANYONE CAN REPLICATE MY SURVEY if you think it is “biased.” The New York Times could replicate my survey and prove I’m wrong.
But they won’t.
And that tells you everything you need to know, doesn’t it?

If they want to argue with this article, THEY need to show us THEIR data and not engage in hand-waving arguments to create FUD that have no evidentiary basis.

The game is over. We have won. You cannot hide from the truth any longer.

We’ll see if anyone wants to challenge this article and get paid 10X their wager if they are right. Bring it on!

Introduction

This article is a follow up on my article entitled, “The death records show the COVID vaccines are shortening lifespan worldwide.” That article gives John Beaudoin credit for being the first to realize that linking the death and vaccination records (a table join) is key to ending the false narrative.

In this article, I show a clever new method for analyzing the death/vax records that is simple and objective; it relies on just a simple division of two time measurements.

The survey

A month ago, on December 25, 2022, I announced the survey below.

The survey asked people if they knew anyone who died in 2020, 2021, or 2022.

If they did know someone, simply report objective facts about the death: age, date died, and if vaccinated, the date most recently vaccinated.

If people knew >1 person who died in the period, just report the person whose details you are most familiar with (e.g., family member vs. friend).

As of January 29, 2023, I received 1,634 responses. The analysis here looks at the responses.

We only consider OBJECTIVE data and our analysis is OBJECTIVE. It’s all math.

If the vaccines are causing death, the analysis will pick it up.

Methodology

The analysis is done by looking at “days in category before death” divided by “days possible in category if you had lived to the end of the observation period.”

We do this for both vaxxed and unvaxxed people… across all ages, and also in various age ranges which I arbitrarily chose. You can choose your own if you don’t like the age categories I chose. It won’t change the result.

Here’s how the method works (credit to Clare Craig who suggested this wording):

Imagine a timeline for 2021 and 2022. For the unvaccinated we would expect an even distribution of deaths over time except for seasonal differences. For each person, we can compare how long they did live in that period with how long they could have lived. A few who died early would have lived for only a tiny fraction of their potential and a few that died late for a large fraction. However, most will be in between and the mean will be 0.5.

For the vaccinated, we start the clock on their date of their last vaccine. The timeline will therefore vary for each person but with a harmless vaccine we would still expect exactly the same distribution – a few early, a few late and most in the middle with a mean of 0.5.

If the vaccine killed people we would end up with more deaths early on. The mean ratio of life lived compared with life that could have been lived will fall below .5.

Given ratio=((time in category)/(time possible in category)) and knowing that the person died sometime in Jan 2021-Dec 2022, we have:

  1. If the intervention (i.e., the vax) does nothing, ratio = .5
  2. If the invention shortens life, ratio <.5
  3. If the intervention increases lifespan, ratio > .5

It’s that simple. The important thing is that the ratio tells us if the intervention is helpful, neutral, or harmful.

The analysis is independent of the rates people die. The fact that older people die faster than younger people is immaterial. Pre-existing conditions, etc. do not matter.

There is an argument to be made that people who got vaccinated first were more vulnerable and were more likely to die, and thus the rate in a category changes over time, but that effect isn’t very large. I’ve run the numbers for those who died and were last vaccinated in 2022 and the numbers are all less than .5. You are welcome to prove me wrong, but you’ll need to do it with evidence, i.e., actual queries and not hand-waving arguments. Numbers talk.

To date, everyone who thinks they can debunk this has produced only handwaving arguments and no analysis.

Sorry, but that’s not very convincing.

Limitations

My survey includes reporters from all over the world, but all the readers speak English and 70% are in the US. The data can be analyzed just for the US and for specific vaccines as well, but below I include all the records to show that I’m not cherry picking and also to get more stability in the numbers (fewer data points creates more noise).

The people who answered are my followers and are most unvaccinated themselves. They are reporting deaths of the person they know the best, whether vaxxed or unvaxxed. I invite fact checkers to validate that people were true to the direction they were given. There are more vaccinated deaths reported simply because 75% of the US population is vaccinated.

The percentage of unvaccinated to total deaths was 29% (222/(222+542)).

So you might think “Ah ha! That proves that the unvaxxed are dying at a higher rate than the vaxxed because it should be only 25% of the deaths that should be vaccinated so this PROVES the vaccines are saving lives!”

No, it just proves that unvaccinated people hang around other unvaxxed people and are slightly more likely to report their deaths.

This is very helpful for our survey for two big reasons:

  1. It gives us enough data in both the vaxxed and unvaxxed buckets so we can do meaningful comparisons between the two buckets
  2. I can’t be accused of bias, e.g., you anti-vaxxers are just reporting vaccinated deaths to make the vax look bad. Clearly this isn’t the case… they are reporting disproportionately more unvaccinated deaths. So it looks very credible because it’s consistent with what you expect to see.

Note that the mix of vaxxed/unvaxxed deaths is immaterial to this analysis. Each cohort is examined independently. If I had 50% vaxxed and 50% unvaxxed deaths, the results would be exactly the same.

It’s important to note that my followers cannot determine the date of death of unvaccinated or vaccinated individuals (unless they have God-like powers). And I have contact info for all the records so they can be “spot checked” to validate that people followed my instructions to report the person they are most familiar with.

There is a recall bias in that people are more likely to report deaths that happened more recently. This shifts the average death time to the right. This is why unvaxxed are > .5 (more about that later).

For vaccinated people, there is also a healthy patient bias. If you are going to die in days due to a fatal cancer, most people would not get vaccinated.

There is some amount of seasonality in deaths that might skew things somewhat. It’s minimal for those <60, and small for the elderly. But we’re looking at a 2 year period so it shouldn’t be much different between vaxxed and unvaxxed.

Gaming

It wasn’t possible to game the survey because nobody, including myself, knew how I was going to analyze the data until after the data was collected.

There was one person who put in a bogus entry (record #260) but that was easily spotted and removed.

The analysis cut off time was before this article was written so anyone trying to pollute the data will be unsuccessful since any new records aren’t included in the analysis.

Transparency

The database has been in public view the entire time that the data has been gathered. When a record is submitted, it appears in the public view.

Verifications

No submissions were deleted (other than record 260 which was clearly gamed) or modified which can be verified by the changelog of the data. The database is hosted by a third party firm.

There is an “integrity check” field indicating which records passed simply sanity check such as date vaccinated < date died. Only those records were processed.

I have the contact information for each reporter. I am looking forward to being contacted by any mainstream “fact check” organization who is willing to be recorded on video as we discuss the article. I’m happy to supply contact info for any line(s) in the survey so the fact checker can verify every record is legitimate.

Expectations

People who die within 2021 to 2022 should be expected to die evenly throughout the period (there is some seasonality so it isn’t flat over the calendar months). Therefore, with no biases, we’d expect that the average days of life is 1 year in any 2 year observation period. So a ratio of .5. The seasonality cancels out.

But due to recall bias (since we are asking people to recall deaths rather than using government records), we’d expect the number to be skewed to dying more recently so maybe we’d see a ratio of .55 for the unvaccinated.

The vaccinated benefit from both recall bias and the healthy patient bias, so it might be .58 or more.

If the vaccines are safe and effective, the ratio of the vaccinated > ratio of the unvaccinated due to the healthy patient bias.

If the vaccines are killing people, the ratio of the vaccinated <= ratio of the unvaccinated (since the healthy patient bias would give the vaccinated an advantage).

If the vaccines are killing people, the ratio will be <0.5.

If the vaccines are safe, the ratio will be >0.5.

Guess what we found? 🙂

The results

The data couldn’t be more clear: the shots are killing people.

The ratio for the vaccinated is .31 or less for every age range with > 5 records.

For the unvaccinated, the ratios are .52 or better for every age range with >5 records

The data is remarkably consistent when there are enough records for the range (generally 10 or more records per the uV# or V # columns).

The values in red are unreliable due to a lack of sufficient data points.

Values in red have too few records to compute an accurate ratio. Ratios >.5 are expected for a safe intervention. Ratios <.5 mean something is killing these people prematurely.

For the unvaccinated, my Airtable filter looked like this and I used the unVaxxed days alive/days possible columns:

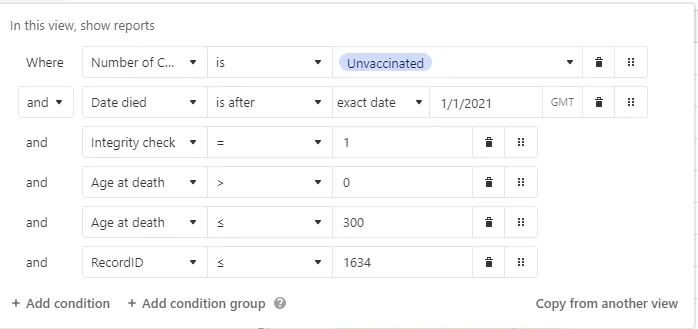
For the vaccinated, my Airtable filter looked like this and I used the Vaxxed days died/days available columns.

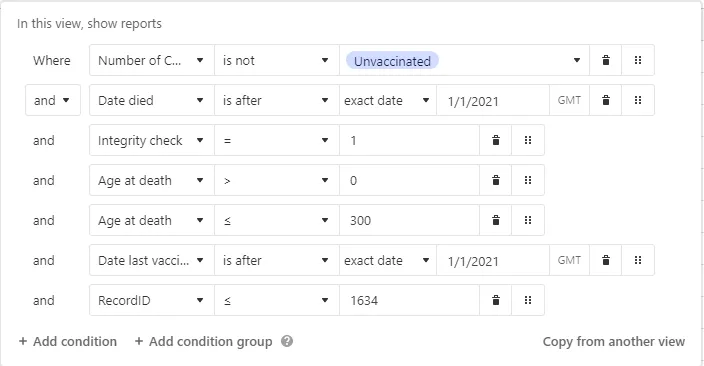
NOTE: The “Integrity check” is NOT complete. But when coupled with the restrictions of the two filtering conditions, invalid records are all filtered out of the final result.

inal result.

Is my analysis wrong?

This is an Occam’s razor analysis. You could get fancier but it wouldn’t change the result. The signal is very very strong that the vaccines should be immediately stopped.

If I have made a mistake, I’d be grateful to see the correct analysis of the data using the same methodology. So if you object, show us the proper analysis.

The data is remarkably consistent for each age range. But there is a huge difference between the vaxxed (.3) and the unvaxxed (.58). This is exactly what I expected to see; no surprises. But it’s IMPOSSIBLE for the blue-pilled medical community to explain how this could possibly happen if the vaccine is so safe since it was supposed to be the other way around.

A simple look at the Notes field confirms the role of the vaccine in these deaths. That’s subjective proof. It shows that the vaccines are not as safe as claimed.

As far as confidence intervals, the numbers are remarkably consistent so the confidence intervals appear to be small. I’ve asked Professor Fenton for the correct way to ascertain these. He’s thinking about it. I’ll update this when I hear back.

But there’s more confirmation…

Failure anecdotes » success anecdotes

Is this analysis consistent with reliable evidence? Yes.

It turns out for the COVID vaccines, the best evidence we have is anecdotal evidence where everything is tracked since government data can be badly wrong as we learned in the UK where mistakes led them into thinking the vaccines were safe (see UK ONS admits their data is flawed; the vaccines may not be beneficial after all. Sorry about that).

As it turns out, it’s easy to find failure anecdotes for the COVID vaccines. The anecdotes we generally find show STRONG failures.

By contrast, it is nearly impossible to find a “success anecdote,” even a weak success. I always ask doctors who will talk to me and they’ve never mentioned a single success story. I do this constantly on Twitter Spaces in full public view and NONE of the DOCTORS will EVER be able to cite an example. In fact, I have not found any medical doctor who has ever been able to cite a single geriatric practice or nursing home where deaths dropped after the vaccines rolled out.

If the vaccines were saving lives, there should be THOUSANDS of “poster elderly” success stories, yet there are none. All the anecdotes are strongly negative. That’s simply impossible if the vaccines are saving “tens of millions of lives” as Neil deGrasse Tyson said on YouTube. When I called Neil to ask him for a success anecdote, he hung up the phone on me.

So we have a pretty good sense just from the failure to find a success that the vaccines are an utter disaster. We didn’t even need to do any numerical calculations!

Lots of things confirm our hypothesis:

  1. Lack of success anecdotes, but failure anecdotes easy to find
  2. People switch from pro- to anti- but not the reverse.
  3. Nobody can explain the 15,000 excess deaths in VAERS for the COVID vaccines. It’s not there for other vaccines, the deaths are all consistent with vaccine deaths. What killed all these people if it wasn’t the vaccine?
  4. Ed Dowd’s book “Cause Unknown” contains tons of data. Where is the document debunking everything in that book and showing the cause of all these deaths, especially the increase in child deaths happening right after the vaccines rolled out for kids.
  5. What about the 770 safety signals in VAERS. Why didn’t the CDC tell anyone about any of those signals? They notified the public about the VSD signal for stroke and didn’t even mention that it also triggered in VAERS.
  6. MIT Professor Retsef Levi calls for a halt to the COVID mRNA vaccines based on his study and others.
  7. The vaccine isn’t as effective as the NEJM led you to believe. A key paper is deeply flawed. In fact, it shows very troubling data as people will soon see: that the vaccine makes .
  8. Large Cleveland Clinic study shows the more you vaccinate yourself, the greater the risk of getting COVID. Whoops!
  9. A New Zealand funeral director noticed 95% of his cases died within 14 days of the shot. I spoke directly with Brenton. He lives in the middle of a retirement community. This is the very age that is supposed to be protected by the shots. Average age is 70+. His records can be verified. Any takers?
  10. Embalmer Anna Foster found that 93% of her cases had telltale rubbery clots. How can anyone explain that? She is hardly alone… 80% of embalmers surveyed report seeing these new style blood clots; they have never been seen before the COVID vaccines rolled out.
  11. Southwest airlines: Pilot deaths have increased 5X after the vaccines rolled out and disability shot up by 10X normal. Pilots are among the healthiest people on the planet.
  12. Geriatric practice: I finally found a large geriatric practice of 1,000 patients, 75% are over 65. Their normal death rate is 11 per year (the mean). In 2022, they had 39 deaths for the entire year. They attribute the 28 excess deaths to the vaccine. If it wasn’t the vaccine, someone needs to explain to us what is killing these people because whatever it is, it needs to be IMMEDIATELY stopped. They can’t go public for fear of retribution.
  13. Savo Island Cooperative (Berkeley, CA): Roughly 150 people. No deaths for 5 years before COVID; 0 in 2020; 1 in 2021; 3 in 2022 and they were all vaccinated and boosted (plus 3 strokes and 4 heart attacks). Reported to me by Jane Stillwater last night at an event I spoke at. Nobody at the event could recall any success anecdotes.
  14. Ed Dowd mentioned the vaccines have killed 800K Americans and disabled 4X as many as killed, 3.2M since the vaccine program began.
  15. The peer-reviewed scientific literature published a paper by Mark Skidmore showing over 217,000 deaths in 2021 alone due to the COVID vaccine. But they are looking at retracting the paper because Mark didn’t include a full bio on one of the funders of the study. Also, he asked a question about deaths from the COVID vaccine and that’s unethical (COVID virus questions are OK and ethical).

Josh Stirling looked at how cities in the US did in 2022 vs. 2021. So it’s a longitudinal study where you compare the city with itself one year ago. This is the best way to see what is going on… did your mortality increase or decrease. Check this out: cities with higher vaccination had larger all-cause mortality increases than cities with lower vaccination rates. In other words, the line goes the “wrong way.” This is devastating for the narrative, but of course consistent with what the death reports are saying. The R2 doesn’t need to be .9 for this to be convincing. They are correlated and it’s the slope of the line that is significant. The slope is the wrong way. That’s the point.

US cities; all ages; compare 2022 vs. 2021 in the same city The line slopes up. In other words, the experts were completely wrong: the vaccines are deadly. This is very compelling proof of harm that is impossible for anyone to explain away with a straight face. When combined with this analysis, it’s not credible to keep claiming the vaccines are safe and effective.

See full article HERE


NOTE: The summary and challenge to prove Steve Kirsh’s analysis wrong is at least as long as what is above. As of the 1/31 update, an error had been discovered and he is re-working against the same data. But he is still challenging Big Pharma and their deep state partners to prove his conclusions wrong and show how they got THEIR numbers.

Loading

196
Categories
Corruption Links from other news sources. Reprints from others.

Kash Patel: ‘Government Gangsters’ Trying to ‘Cover Up’ Biden Classified Document Scandal

Visits: 15

Former White House national security official Kash Patel spoke with Breitbart News about how “government gangsters” at the U.S. Department of Justice (DOJ) are “scrambling” to “cover up” President Joe Biden’s classified document scandal and the deep state’s targeting of former President Donald Trump.

LISTEN:

Breitbart News Saturday host Matthew Boyle noted that former President Donald Trump, former Vice President Mike Pence, and President Joe Biden are all in controversy stemming from classified documents and asked Patel to break down the differences in each case.

The key difference is that in Trump’s case, he had the presidential authority to declassify the documents that were marked classified and found at Mar-a-Lago, Patel explained.

“When it comes to classified documents, there’s one person on planet Earth that is a universal arbiter of classification. That means they can declassify and classify at will, that is a sitting president of the United States. That is it,” Patel said. “Nobody else can do that, unless that power is delegated to them through the Office of Director of National Intelligence, and through the chain of command, from the White House. A vice president cannot do it.”

Patel accused Biden’s DOJ of creating a “two-tier system of justice” to try and “cover up” Biden’s classified document case, despite the raid on Trump’s Mar-a-Lago estate. Patel urged House Republicans to subpoena documents from the FBI’s investigation into Biden’s classified documents “to show the world how bad and rotten the DOJ is.”

“And what we now know that this, they say the Biden investigation began in November, because a librarian said that the documents were overdue. I don’t believe that for one second,” Patel said. “This investigation began from Hunter Biden’s laptop, because they found classified information that he was using to shill and hawk documents to the Ukraine so he can get paid. That’s where it came. And that’s where the house must get the documents from the FBI to show the world how bad and rotten the DOJ is.”

Boyle noted that the $83,000 monthly payments Hunter Biden received for his business dealings with Ukrainian-based Burisma were so the company could get “an inside track to whatever’s going on in the White House.”

Patel pointed out that former President Barack Obama has been silent amid Biden’s classified documents scandal and agreed with Boyle’s suggestion that Obama be brought into the House committees to testify under oath.

Patel said:

But whether or not Barack Obama declassified certain documents, he certainly didn’t declassify documents that were classified when Joe Biden was Senator. Now we know that. Joe Biden has documents dating back 20 years. So Barack Obama had nothing to do with though, so even if you declassified some of this stuff Joe Biden took, and you’re right, his deafening silence is noteworthy here, he could have just come out and said, nothing to see here. I declassified those for Joe, he told me about them. And, you know, no big deal.

Patel also criticized the media for referring to “sets” of documents found in Biden’s possession because “one set could be 1000 pages.”

“In my career. I’ve never or rarely have I ever seen one set equal one page. And they’re doing this on purpose,” Patel said. “Of course at Mar-a-Lago, they strewn all the paperwork on a floor and say, ‘look at all of this stuff.’ With Biden, it’s like, ‘oh, he only had six sets here, and four sets there and 12 sets there,’”

“So this information that’s been classified has been in the wild in unsecure facilities for multiple decades, being touched and handled by people who don’t have the appropriate security clearance to do it, namely Hunter Biden, who has used it to gain inappropriately and unlawfully contracts and advisory work from foreign governments. that in and of itself, is there another violation of the federal statute,” Patel continued.

Boyle pointed out that Biden has a plethora of documents at the University of Delaware waiting to be released from his time in the Senate.

Patel, a former prosecutor, said he would have started looking for more classified documents at Biden’s center at the University of Delaware.

“But Matt, you and I know we don’t live in a in a uniform system of justice anymore. This is not the United States of America from 10 years ago. It’s not even the USA from seven years ago,” Patel said. “This government, under government gangsters like Merrick Garland and Chris Wray, have determined that anything that benefits Joe Biden and hurts Donald Trump is going to dictate how they operate the law to the facts at hand. And that is a total destruction of justice.”

Patel urged House Republicans to subpoena documents from “every single location Hunter and Joe ever resided in, ever uses an office space ever had an association with or ever had an employment agreement with.”

Patel explained that “Joe Biden is not our target,” instead, “our target is the administrative deep state that’s being run by these government gangsters.”

Patel continued:

And we need to educate everyone that this total bastardization of due process by using the Biden classified documents scandal criminal enterprise to show them that even though Merrick Garland goes to the podium every week and says we are prosecuting without fear or favor, he is prosecuted because he is in fear and needs to curry favor with the deep state so that he can maintain his job and look good in the media.

Boyle then asked Patel to give advice to House Republicans as they proceed with their investigations into Biden.

Patel encouraged House Republicans to “follow the money.”

He said:

These people need to do what we did during the Russia gate, which is follow the money. Money never lies. Subpoena the money, subpoena every bank that the Biden’s had anything to do with in relation to the Ukraine, China, and other pay-for-play schemes. And why do I say that? Because the banking information relates right back to the documentation, which is the scene of a crime here, the Ukraine document that Hunter Biden produced from classified information is point in case, you know, exhibit number one, to land a seven-figure contract in the Ukraine. That is hard evidence that shows you and the American public, what their actual intentions were with classified information, it was to take it to steal it and to peddle it for personal financial gain.

He also cautioned against launching too many investigations. Instead, Patel suggested they conduct “like two or three investigations,” with the FBI and DOJ being the focus of one investigation and “maybe the border and maybe Fauci.”

“If we can do those three things Well, then we will provide the American public with documentation to show the corruption of the government gangsters that are operating these agencies and departments,” Patel added.

Jordan Dixon-Hamilton is a reporter for Breitbart News.

Loading

167
Categories
Links from other news sources. Reprints from others.

Just putting this out there. Professor: COVID pandemic, inflation make minority parents ‘devolve’ to poor behavior

Visits: 18

‘Historically marginalized communities like Philadelphia experience even higher levels of trauma’A professor at Thomas Jefferson University said incidences of Philadelphia parents and other adults coming to schools to settle their kids’ arguments and threaten teachers is due in part to the effects of the COVID pandemic, inflation and gun violence.Psychologist Kirby Wycoff (pictured) told The Philadelphia Inquirer that “historically marginalized communities like Philadelphia experience even higher levels of trauma than other communities,” and as such “may devolve to behavior that’s not helpful.”

“These families are stressed out, overwhelmed, and not sure how to get their needs met,” Wycoff said. “It’s not OK, but I can understand where it’s coming from.”

Over the last two years, the 217 schools in the city district have seen a concerning number of threats and incidents involving adults. In the first half of this school year there have been “five assaults on employees by parents and 35 threats by parents to employees.” At this same time last year there were two and 41, respectively.

Jerry Jordan, president of the Philadelphia Federation of Teachers, related how he recently approved the transfer of a teacher who had been assaulted by a student and, soon thereafter, members of the student’s family.

“Adults just marched right into the school, ignored the rules of checking into the office, walked right into the classroom, and attacked the teacher [physically],” Jordan told the Inquirer.

MORE: Philly teachers fed up with knuckleheaded discipline policies

Former Principal Robin Cooper said school district officials share the blame: “Why would I act appropriately if there’s nothing in it for me, if I know I can come up and act a fool and my kid still gets to terrorize a school? Our schools are not bad if the supports are there to hold people accountable for behavior.”

Cooper’s comments reflect the situation in many American schools: a paucity of teachers.

Despite media accounts about things like poor salaries, constant student misbehavior and lack of administrative support rank consistently highest among educator (and potential educator) concerns.

Wycoff’s solutions — more school “resources” and “promoting trauma-informed practices across systems” — sound a lot like methods in line with “restorative justice.”

According to her faculty page, Wycoff is co-author of articles such as “Motherhood Among Young Black Women: Wisdom and Survival amidst Trauma, Racism, and Structural Oppression,” “‘I ain’t ready: It’s time to get ready:’ Exploring Dichotomous Feelings about Motherhood among Young Women of Color,” and “Applying a MTSS Framework to Address Racism and Promote Mental Health for Racially and Ethnically Minoritized Youth.”

MORE: Philly schools launch ‘comprehensive initiative’ to end racism

Loading

175
Categories
Crime Daily Hits. Links from other news sources. Uncategorized

California Progressives rejoice. Rest of the population mourns. Their gun control laws only allowed one mass shooting this week.

Visits: 16

California Progressives rejoice. Rest of the population mourns. Their gun control laws only allowed one mass shooting this week. Yes my friends it looks as if gun control is finally working in California. Only one mass shooting this past week.

A mass shooting took place Thursday in the wealthy Beverly Crest neighborhood of Los Angeles, killing three and wounding four people according to police. The shooting took place at a short term rental on the 2700 block of Ellison Dr. No suspect or motive has been identified as of yet but the public is not believed to be in danger. It has not been determined whether a party was taking place.

It’s working so well that California lawmakers are calling for even tougher laws. Oh they work so well. Don’t you think?


Loading

205
Categories
Links from other news sources. Reprints from others. Uncategorized

Putting this out there.Croatian President Calls Germany’s ‘We Are at War With Russia’ Comment Madness

Visits: 17

Croatian President Calls Germany’s ‘We Are at War With Russia’ Comment Madness. Croatian President Zoran Milanovic responded to the German foreign minister saying “we are fighting a war against Russia” by calling the remark “madness” and wishing Germany better luck than with the last war they had with Russia 70 years ago.

Milanovic was responding to the bizarre and inflammatory statement made by German Foreign Minister Annalena Baerbock during the Parliamentary Assembly of the Council of Europe on Tuesday.

Croatian President Zoran Milanovic responded to the German foreign minister saying “we are fighting a war against Russia” by calling the remark “madness” and wishing Germany better luck than with the last war they had with Russia 70 years ago.

“Do you want us to enter the war?” asked Milanovic during a visit to the port city of Split, adding that Croatia “should in no way help” Ukraine militarily.

The Croatian president expressed his amazement that such aggressive rhetoric was being spouted by a representative of the usually pacifist German Greens.

“If we are at war with Russia, then let’s see what we need to do. But we won’t ask Germany for its opinion,” Milanovic asserted. “Let them figure out who is the actual chancellor over there. I’ve been in politics for a long time, and our country has been through a lot, but I’ve never seen this kind of madness before.”

Milanovic condemned NATO powers for flooding the region with tanks and other weaponry in order to prolong the war.

“Those tanks may burn, or they may reach Crimea, but Croatia will have nothing to do with it,” he insisted.

As we previously highlighted, US weapons sales to other countries rose from $103.4 billion in 2021 to $153.7 billion in 2022, with Lockheed Martin, Northrop Grumman and Raytheon all making a killing out of the Ukraine conflict.

In a related development, the French Foreign Ministry claimed that the US, Germany and other countries sending battle tanks to Ukraine did not mean that NATO was at war with Russia.

“We are not at war with Russia and none of our partners are,” ministry spokeswoman Anne-Claire Legendre said.

Loading

198
Categories
Emotional abuse Leftist Virtue(!) Sexual Abuse

You go Girl! JKR Infuriates Transgender Community with Advice About Looking in the Mirror

Visits: 51

SEX IS REAL

Men are men, and Women are women, period.

Few things in modern media have been more dizzying than watching once-beloved “Harry Potter” author J.K. Rowling become public enemy No. 1 in some people’s eyes because of her stringent belief that men are men and women are women.

Rowling became a highly public target of abuse from the far left, and LGBT activists in particular, in 2019, when she criticized the firing of a researcher who, among other things, said, “it is impossible to change sex.”

“Dress however you please,” she tweeted at the time. “Call yourself whatever you like. Sleep with any consenting adult who’ll have you. Live your best life in peace and security. But force women out of their jobs for stating that sex is real?”

The author soon found herself on the front lines of the battle over transgender rights.

Rowling, a domestic violence survivor, explained in a 2020 blog post that she feared “the new trans activism” was “offering cover to predators.”

“When you throw open the doors of bathrooms and changing rooms to any man who believes or feels he’s a woman … then you open the door to any and all men who wish to come inside,” she wrote.

(Note: I (and others) have been saying for years the same thing — and backed it up with news stories that proved that it had already happened. — TPR)

In 2021, the author tweeted that “hundreds of trans activists have threatened to beat, rape, assassinate and bomb me.”

But Rowling hasn’t backed down.

Poll on The Western Journal, shot at 5 pm EST 1/27/23

On Wednesday, she called out the “misogyny” of men trying to dictate what women should tolerate.

It was a powerful condemnation of transgender extremism.

Why is she, a woman, being attacked for simply stating men can’t have periods, get pregnant, or menstruate? Why do men think they have the right to silence her as she speaks out against the invasion of spaces for women and girls by members of the opposite sex?

Rowling’s resistance to the far left’s transgender movement has made her persona non-grata in certain circles.

For example, the forthcoming “Harry Potter” video game “Hogwarts Legacy” has come under fire for being associated with Rowling despite her complete lack of involvement aside from creating the source material.

Although she is a liberal feminist, angry “Harry Potter” fans lament on social media that she has become some sort of far-right figure.

More anger followed her tweet Wednesday.


Rowling became a household name with the popularity of the “Harry Potter” children’s book series, the first of which was released in the U.S. in September 1998.

While the “Potter” books ended in 2007, their popularity has sprung into countless media offshoots, including movies, video games, and plays.

(Rowling has written other books under her own name and the pseudonym Robert Galbraith.)


What say you?

Loading

209

Categories
Corruption Politics Uncategorized

Thanks to Joe Biden and the National Archives, President Trump walks.

Visits: 45

Thanks to Joe Biden and the National Archives, President Trump walks. As you know, Biden carried on about how President Trump had top secret documents and how irresponsible it was. Well the National Archives jumps in and demands the missing documents back. Trump had the power to declassify. So what happens? Biden who doesn’t have that power has top secret documents for months and says nothing.

The National Archives says nothing cause they claim they didn’t know. Three more times documents are found with Biden. Again the National archives has no clue. So now what do they do?

National Archives asks all past Presidents and VP to look for top secret documents. No planned raids or FBI agents showing up guns drawn. The wives don’t have to worry about anyone going threw the panty drawer. Moral of the story? Trump walks.


Loading

464
Categories
Education Public Service Announcement Reprints from others.

States with Best & Worst Education (2023) Scholaroo ventures to discover the best and worst school systems across three factors — Student Success, Student Safety and School Quality.

Visits: 15

States with Best & Worst Education (2023)

Scholaroo ventures to discover the best and worst school systems across three factors — Student Success, Student Safety and School Quality. I’m in agreement with some and disagree  with some. Interesting how California is good in Math but at the bottom in  others ranked 45. My Ohio is ranked 22.

Education is a key indicator of the economic, social, and cultural success of any state. To analyze school systems across the United States, Scholaroo has identified various criteria such as student success, school quality, and student safety to compare all fifty states in order to assess which school systems are the best and worst in this 2023.

Student success can be measured through various academic metrics such as test scores and graduation rates. School quality accounts for the level of resources available to school districts. Finally, student safety is an important factor in determining school system rankings; this includes school security measures, bullying prevention programs, and other initiatives designed to ensure students feel safe at school.

The data set considers a depth of topics across 43 key indicators, ranging from metrics that measure how much a student is enabled to succeed, to metrics that measure the school’s security.

If you want to know which state has the best education system for 2023, here we show it to you.

Rankings of States with Best & Worst Public Schools

Category Breakdown

Methodology

In order to determine the best and worst school systems per state, Scholaroo compared the 50 states across three key dimensions:

  1. Student Success
  2. Student Safety
  3. School Quality

We evaluated those dimensions using 43 relevant metrics, which are listed below with their corresponding weight. Each metric was graded on a 100 point scale, with a score of 100 being the max.

Finally, we determined each state’s weighted average across all metrics to calculate its overall score and used the resulting scores to rank-order our sample.


Student Success (25 Points)

High School Graduation Rate: Double Weight (2.27 points)

Note: This metric measures the percentage of graduates High school graduates or higher.

High School Dropout Rate: Double Weight (2.27 points)

Note: This metric measures the percentage of high school dropouts among persons 16 to 24 years old (status dropout rate).

SAT Scores: Double Weight (2.27 points)

Note: This metric measures the SAT mean scores of High School Seniors.

ACT Scores: Double Weight (2.27 points)

Note: This metric measures the average ACT score (Composite score: English, Mathematics, Reading, Science scores) of Graduates.

College-Going Rates: Double Weight (2.27 points)

Note: This metric measures the percentage of High School graduates going directly to College.

Reading Test Scores: Double Weight (2.27 points)

Note: This metric measures the Average of Scale Scores between 4th and 8th Grade Reading scores.

Math Test Scores: Double Weight (2.27 points)

Note: This metric measures the Average of Scale Scores between 4th and 8th Grade Mathematics scores.

Science Test Scores: Double Weight (2.27 points)

Note: This metric measures the Average of Scale Scores between 4th and 8th Grade Science scores.

AP Exam Participation: Regular Weight (1.14 points)

Note: This metric measures the percentage of graduates who took an AP exam during High School.

AP Exam Scores: Regular Weight ((1.14 points)

Note: This metric measures the percentage of the Class of 2021 scoring a 3 or higher on an AP exam during High School.

Students in Gifted Programs: Regular Weight (1.14 points)

Note: This metric measures the percentage of public students enrolled in gifted/talented programs.

Class Suspension Rates: Regular Weight (1.14 points)

Note: This metric measures the number of days missed due to suspension (per School).

Expulsion Rate: Half Weight (0.57 points)

Note: This metric measures the percentage of student expulsions (per school).

Retention Rate: Half Weight (0.57 points)

Note: This metric measures the percentage of 8th Grade students retained (per school).

Student Participation in Sports: Regular Weight (1.14 points)

Note: This metric measures child participates in a sports team or did he or she take sports lessons after school or on weekends, age 6-17 years.


School Quality (35 Points)

Annual per-pupil spending: Regular Weight (3.50 points)

Note: This metric measures the annual per-pupil spending in Public Elementary-Secondary School System Finances.

School Rankings: Regular Weight (3.50 points)

Note: This metric measures the percentage of presence of Public High Schools in the Top 100

0 Best U.S Schools by U.S. News & World Report.

Pupil/ Teacher Ratio: Regular Weight (3.50 points)

Note: This metric measures the pupil/teacher ratios in public elementary and secondary schools.

Presence of Guidance Counselors: Regular Weight (3.50 points)

Note: This metric measures the number of guidance counselors per Public High School.

Presence of School Health Councils: Half Weight (1.75 points)

Note: This metric measures the percentage of Secondary Schools with one or more School Health Councils.

Full-Time Registered Nurse: Regular Weight (3.50 points)

Note: This metric measures the percentage of Secondary Schools that have a Full-Time Registered Nurse who provides Health Services to students.

Health Education Curriculum: Half Weight (1.75 points)

Note: This metric measures the percentage of Secondary Schools that required Health Education Instruction in grades 6–12.

Healthy Eating Curriculum: Half Weight (1.75 points)

Note: This metric measures the percentage of Secondary Schools in which Teachers taught the benefits of healthy eating.

Sexual Health Curriculum: Half Weight (1.75 points)

Note: This metric measures the percentage of Secondary Schools in which Teachers taught all 20 sexual health topics (including topics related to how HIV and STD’s are transmitted, contraception methods, sexual orientation, gender expression, creating and sustaining healthy relationships, sexual risk behaviors, etc) in a Required Course in Any of Grades 9, 10, 11, or 12.

Teachers meeting State Licensing Requirements: Regular Weight (3.50 points)

Note: This metric measures the percentage of teachers that meet all State Licensing/Certification Requirements.

Level of Experienced Teachers: Regular Weight (3.50 points)

Note: This metric measures the percentage of teachers with 3 or more years of experience.

Average Teachers’ Salary: Regular Weight (3.50 points)

Note: This metric measures the cost of living adjusted to the average teacher salary.

Student Safety (40 Points)

Bullying Rate: Regular Weight (3.33 points)

Note: This metric measures the percentage of High School students who were bullied on school property.

Exposure to Illegal Drugs: Regular Weight (3.33 points)

Note: This metric measures the percentage of High School students who were offered, sold, or given an illegal drug on school property.

Absence of Students due to Safety Concerns: Regular Weight (3.33 points)

Note: This metric measures the percentage of High School students who did not go to school because they felt unsafe at school or on their way to or from school.

Bullying and Sexual Harassment Prevention: Double Weight (6.67 points)

Note: This metric measures the percentage of Secondary Schools where all school staff received professional development on preventing, identifying, and responding to student bullying and sexual harassment.

Sexual Assault Rate: Half Weight (1.67 points)

Note: This metric measures the percentage of Sexual Assault.

Rape or Attempted Rape Rate: Half Weight (1.67 points)

Note: This metric measures the percentage of Rape or Attempted Rape.

Robbery with a Weapon Rate: Half Weight (1.67 points)

Note: This metric measures the percentage of robberies with a Weapon.

Robbery with a firearm or explosive Rate: Half Weight (1.67 points)

Note: This metric measures the percentage of robberies with a firearm or explosive.

Robbery without a weapon Rate: Half Weight (1.67 points)

Note: This metric measures the percentage of robberies without a weapon.

Physical attack or fight with a weapon Rate: Half Weight (1.67 points)

Note: This metric measures the percentage of physical attacks or fights with a weapon.

Physical attack or fight with a firearm or explosive device Rate: Regular Weight (3.33 points)

Note: This metric measures the percentage of physical attacks or fights with a firearm or explosive.

Physical attack without a weapon: Half Weight (1.67 points)

Note: This metric measures the percentage of physical attacks without a weapon.

Threats of physical attack with a weapon: Half Weight (1.67 points)

Note: This metric measures the percentage of threats of physical attacks with a weapon.

Threats of physical attack with a firearm or explosive device: Half Weight (1.67 points)

Note: This metric measures the percentage of threats of physical attacks with a firearm or explosive device.

Threats of physical attack without a weapon: Half Weight (1.67 points)

Note: This metric measures the percentage of threats of physical attacks without a weapon.

Possession of a firearm or explosive device: Regular Weight (3.33 points)

Note: This metric measures the percentage of possession of a firearm or explosive device.

Loading

184

Categories
Daily Hits. Just my own thoughts Links from other news sources.

Why my articles are short, sweet, and to the point. That’s my story and I’m sticking to it.

Visits: 21

Why my articles are short, sweet, and to the point. That’s my story and I’m sticking to it.

This article was originally posted here.

First I must confess that by trade I’m not a journalist or professional writer. Just a 69 year old white dude retired and living the good life. But I’m trying my best to be a good writer. One thing you won’t see a long original article from me.

My articles are short and to the point. I know that I myself will most of the time see an article and usually stop after the first few paragraphs. Now when doing research I will read the whole contents. But most of my articles are usually two maybe three paragraphs. My feeling is that if I can’t get my point across in less than 500 words, 10,000 words will just bore you


Start writing today. Use the link below to create your Substack and connect your publication with Josh’s Newsletter

Start a Substack


Loading

190

Categories
Back Door Power Grab Immigration Opinion The Border Un documented.

The Farce of Real ID: Creating Second-Class Citizens

Visits: 20


Official Penn DOT website blurb

Note the date above: May 7, 2025. On that date, you will become a second-class citizen unless you bow to your masters’ demands.

Papers, please!

Although it’s been delayed several times, the insidious Real ID is coming. You will need to pay for the government’s approval so you can board a flight that NEVER LEAVES THE COUNTRY. And you won’t be able to seek redress of grievances because you won’t be ALLOWED into a Federal — and likely state — building if you don’t have their “Good Sheeple” ID to see your elected representatives. You won’t even be able to check with your local Social Security office about retirement without it. Or register to vote — if you’re a native-born American, that is.

Already, Drivers License locations have a security guard stationed inside them, because “Real ID” is given out there.

So far it’s supposedly a one-and-done deal, once you pay, the Real ID gold star is yours for life.

Does anyone really believe that the bureaucrats won’t draw from that well again — and again? Isn’t that what we were promised for the Covid-19 clot shot, one-and-done? How about the promise that Federal Income tax would only be on the rich? Or that electric cars would be cheaper to run — and less polluting — than internal combustion vehicles?

Okay, so maybe you don’t need to fly across the country, so what? Remember though that the TSA controls ALL public transportation. Think I’m kidding? Did you ever see those notices like on City buses: “The TSA requires all passengers to wear a mask….” How long do you suppose it will take the elitists to require Real ID to board a cross-town bus? They’re already trying to take our cars away from us.

Real ID is anathema to our country’s ideals

The very idea of Real ID is anathema to what the country stands for (or used to stand for) in the first place. In the second place, does anyone care to bet that the current surge of illegal immigrant/future democrat voters won’t need it — or that the elitists will provide it to them so they can continue to vote democrat?

I didn’t think so.

I know some leftist loons will claim I’m a conspiracy theorist. OTOH, how many things that the left decried as a “conspiracy theory” has been proven true?

Loading

508

Verified by MonsterInsights