Side effects include a multitude of things the shot should NOT be doing.
Views: 20
When a COVID infection wave hit the most and least vaccinated states in 2022, the most vaccinated state had the higher COVID case rates and the higher relative death peaks.
So just for fun, I thought I’d see how these states fared when there was a huge COVID infection outbreak at the start of 2022 that affected both these states.
It turned out that the least vaccinated state had the lower rise in all-cause mortality (1.25 vs. 1.42) vs. avg mortality for the year.
In other words, vaccination appeared to increase all-cause mortality when COVID hit.
However, it might be the case that Rhode Island simply was “hit harder” by the COVID wave with twice as many COVID infections per capita. Or was Rhode Island hit harder because more people were vaccinated and thus more susceptible to infection which is what the Cleveland Clinic study showed very clearly?
By looking at a younger age group, we see a 3X disparity between the two states. The least vaccinated state came out on top.
We have further, and more conclusive, confirmation from an extensive study done by Josh Stirling. There is simply no way for anyone to explain those results which looked at every county in the US.
34% increase in Covid deaths in most vaxxed states vs least vaxxed. In yet ANOTHER study. How many reports have to be published before the truth can no longer be shouted down?
The bottom line: higher vaccination —> higher deaths for all age groups. That’s why 15-year-olds with heart attacks are now the new normal when they were non-existent before the vaccines rolled out.
Methodology
COVID waves are when the CDC would expect the most vaccinated states to do the best compared to the average death rate for the year. So we’d expect a smaller rise in deaths during a COVID infection wave compared to the deaths over the year.
The biggest COVID death peak is at the start of 2022.
So the method is pretty simple: compare the worst four weeks at the start of 2022 with the average death rate for the year in that state. The winner should have the lowest ratio.
Let’s try the next age group down which is 45-64 over the same “deadly” period.
Weeks 1-4 avg for Wyoming=(24+23+22+16)/4=21.25 Average for 2022=19.25 Ratio: 21.25/19.25= 1.1
Weeks 1-4 avg for Rhode Island: (50+46+44+31)/4=42.75 Avg for 2022=32.6 Ratio: 42.75/32.6=1.31
Again, Wyoming had the smaller spike among that age group.
A possible explanation for the discrepancy
The only way for a pro-vaxxer to attack this result is to claim that Rhode Island had a COVID infection wave in January 2022, but Wyoming missed the wave.
Let’s check that out…
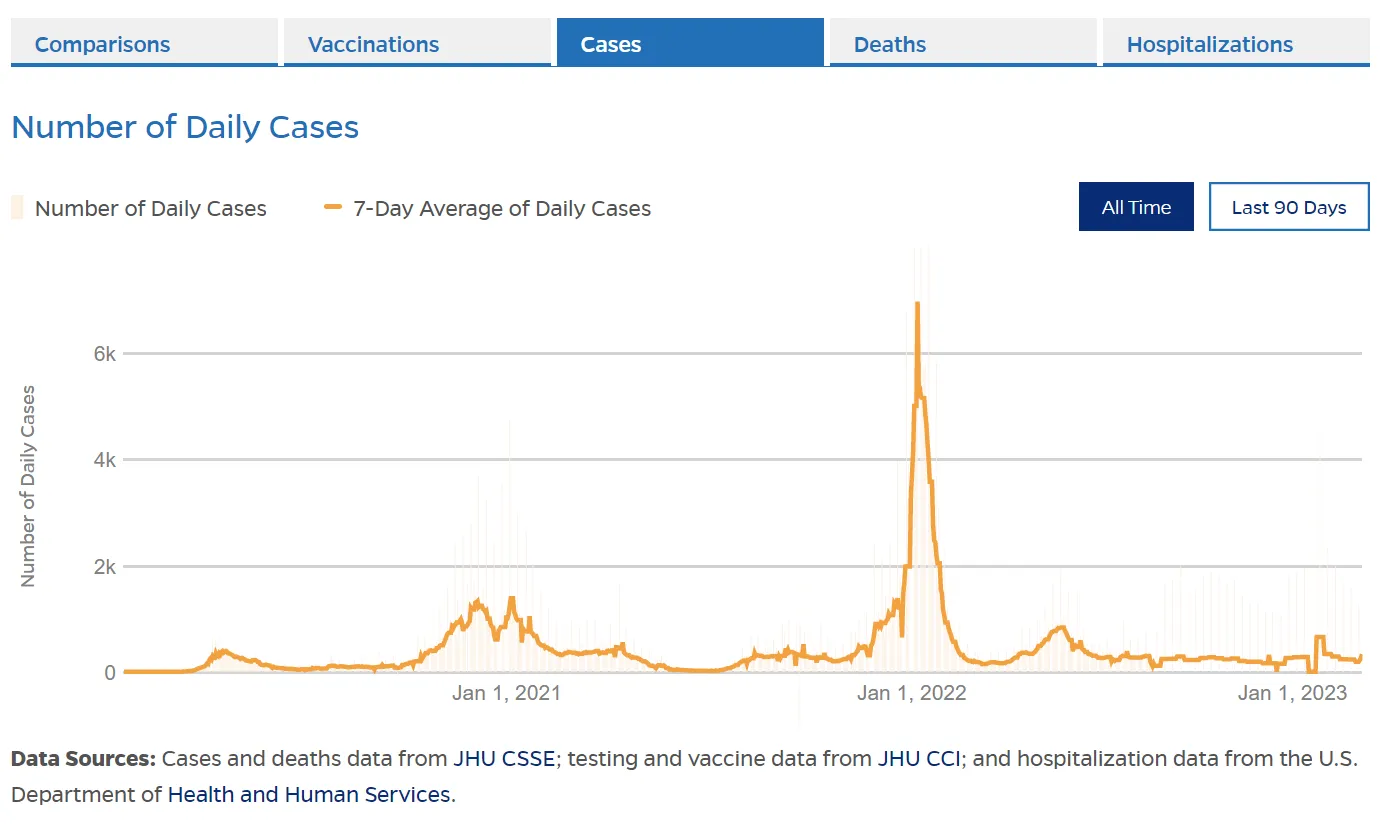
These are the COVID cases for Rhode Island:
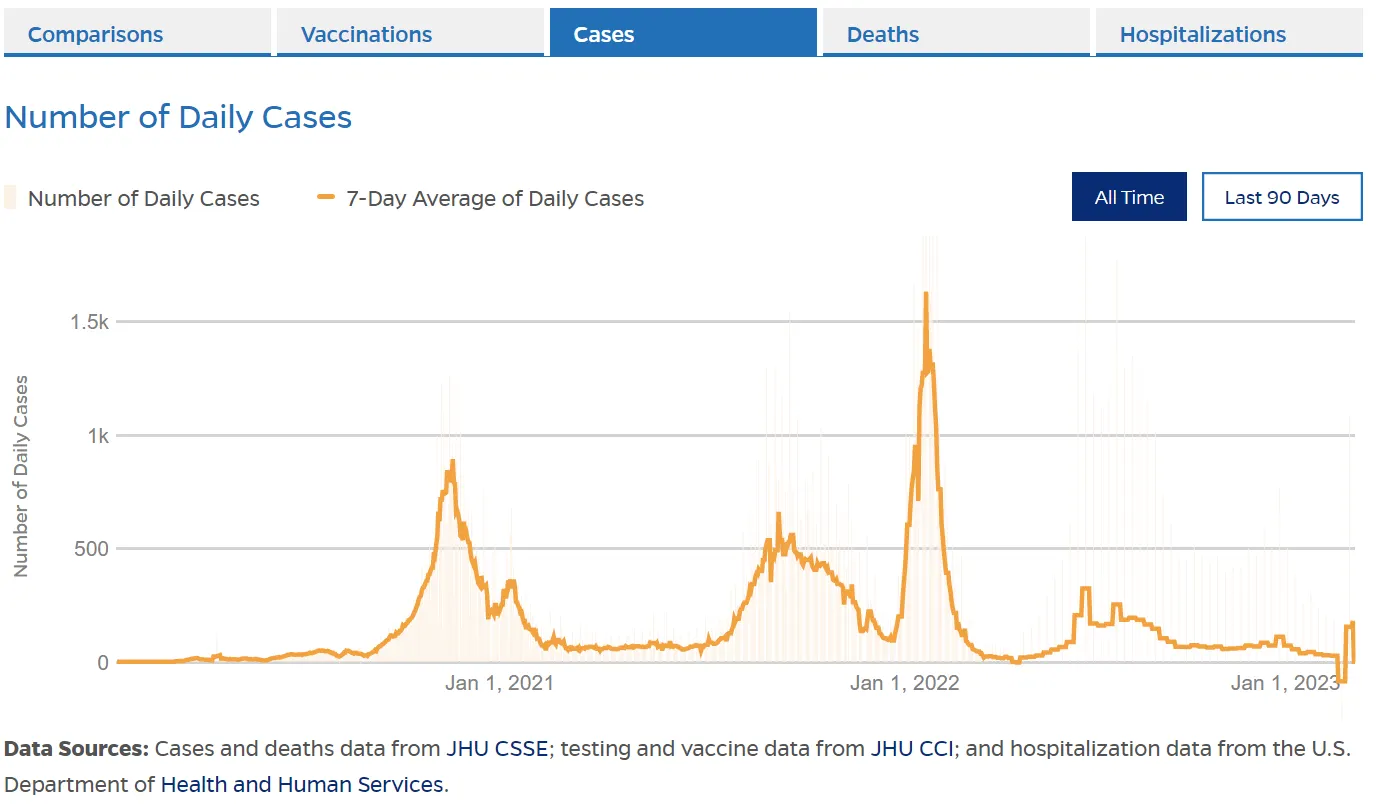
Here are the COVID cases for Wyoming:
Isn’t this interesting? The pre-vax peak is relatively close to the post-vax peak.
So it was a fair test. Both states had their largest COVID peaks in January. So that was fair.
However, you could also argue that Rhode Island was “harder hit” by the COVID wave than Wyoming and that accounts for the greater all-cause mortality.
Let’s see if that is true.
The population is 1.1M in Rhode Island vs 578K in Wyoming, so Rhode Island is 1.9X larger, but they had 4X as many cases!
So for the 65-74-year-old age group, the most vaccinated state did slightly better since it was hit harder than the ratios could account for! But see the next section…
However, when we look at the 45-64 year age group, we have a spike that is 3X higher in Rhode Island. That’s hard to explain since there is only a 2X per capita increase in cases.
Did Rhode Island have more cases because it is more vaccinated?
For some insights into this, look at the ratio between the pre-vax peak in Wyoming vs. the peak around Jan 2022… it’s only about 50% higher. But the pre-vax vs. post-vax peak in Rhode Island is more than 4X higher!!!Did Rhode Island simply get unlucky and have an 8-fold increase (=4/.5) in the relative sizes of the COVID infection peaks?
I looked at the next two states on the list: Alabama (least vaccinated) and Vermont (most vaccinated). I compared the pre-vax and post-vax peaks and found the same ratio! The higher vaxxed state had a greater infection ratio pre- vs. post-vax (2564/248=10.3X) than the less vaxxed state (17106/4221=4.05).
Isn’t that interesting? In short, it appears the more vaccinated the state, the greater the COVID infection rate on a per capita basis.
What’s the right answer here?
Josh Stirling looked at how cities in the US did in 2022 vs. 2021. He did a longitudinal study where you compare the city with itself one year ago. This is the best way to see what is going on… did your mortality increase or decrease?
Check this out: cities with higher vaccination had larger all-cause mortality increases than cities with lower vaccination rates. In other words, the line goes the “wrong way.”
The line goes the “wrong way.”
This is devastating for the narrative, but of course consistent with what the death reports are saying.
The R2 doesn’t need to be .9 for this to be convincing. They are correlated and it’s the slope of the line that is significant. The slope goes the wrong way. That’s the point.
Could someone argue that this could be caused by other factors? Sure.
But this result is consistent with other analyses, such as the Devil’s Advocate global analysis by Martin Neil and Norman Fenton showing a similar effect (though not longitudinal).
And how is anyone going to explain why we can’t seem to find any nursing home where the death rates went DOWN after the vaccine program was rolled out?
For example, I know one nursing home in Melbourne, Australia with around 90 people who had close to 30 deaths within 12 months after the vaccines rolled out. So we know it wasn’t COVID that killed people in such huge numbers since they were all vaccinated. So I wonder how they died? I have a video of their death announcements.
Finally, a large geriatric practice (around 1,000 patients, 75% over 65, had just 4 COVID deaths (vaccinated) and 1 COVID death (unvaxxed). Population was 85% vaxxed. More important was that in 2022, instead of the normal 11 deaths, they had 39 deaths. They attributed the excess to the vaccine. So it would be difficult for anyone to explain that data. But I’m open to hearing it!
[Several charts shown in a previous article have been omitted for space reasons. The original article is HERE:]
Summary
If the vaccine really worked, the state with the lowest vaccination rate should have the highest spike in all-cause mortality during a COVID wave. That wasn’t the case for the 45-64 age group and it’s arguably not true for the 65-74 age group if you believe that the higher cases are due to higher vaccination rates.
Josh Stirling’s analysis of all cities in the US makes it clear that it’s more likely than not that the vaccines have resulted in a net increase in deaths and thus were a very dumb intervention.
This is the original article (New items follow below.)
Official Penn DOT website blurb
Note the date above: May 7, 2025. On that date, you will become a second-class citizen unless you bow to your masters’ demands.
Papers, please!
Although it’s been delayed several times, the insidious Real ID is coming. You will need to pay for the government’s approval so you can board a flight that NEVER LEAVES THE COUNTRY. And you won’t be able to seek redress of grievances because you won’t be ALLOWED into a Federal — and likely state — building if you don’t have their “Good Sheeple” ID to see your elected representatives. You won’t even be able to check with your local Social Security office about retirement without it. Or register to vote — if you’re a native-born American, that is.
Already, Drivers License locations have a security guard stationed inside them, because “Real ID” is given out there.
So far it’s supposedly a one-and-done deal, once you pay, the Real ID gold star is yours for life.
Does anyone really believe that the bureaucrats won’t draw from that well again — and again? Isn’t that what we were promised for the Covid-19 clot shot, one-and-done? How about the promise that Federal Income tax would only be on the rich? Or that electric cars would be cheaper to run — and less polluting — than internal combustion vehicles?
Okay, so maybe you don’t need to fly across the country, so what? Remember though that the TSA controls ALL public transportation. Think I’m kidding? Did you ever see those notices like on City buses: “The TSA requires all passengers to wear a mask….” How long do you suppose it will take the elitists to require Real ID to board a cross-town bus? They’re already trying to take our cars away from us.
Real ID is anathema to our country’s ideals
The very idea of Real ID is anathema to what the country stands for (or used to stand for) in the first place. In the second place, does anyone care to bet that the current surge of illegal immigrant/future democrat voters won’t need it — or that the elitists will provide it to them so they can continue to vote democrat?
I didn’t think so.
I know some leftist loons will claim I’m a conspiracy theorist. OTOH, how many things that the left decried as a “conspiracy theory” has been proven true?
We need to remove the upcoming “Real ID” restrictions for access to airlines and government buildings
The much-delayed “Real ID” will violate the Constitution if allowed to go into effect.
First, In limiting access to ALL federal buildings only to those with a “Real ID,” the law infringes on the 1st amendment right “..to petition the Government for a redress of grievances” Already you can find armed security personnel in many federal and other government buildings. If you can’t get into the building, you can’t see your elected Congressional representatives or testify before any federal entity. If they can make exceptions, then the law is i weapon to silence critics, not to protect anyone.
Second, The need for a “Real ID” to fly on a commercial airplane WITHIN THE UNITED STATES is effectively a “no-fly” list for citizens who don’t desire a “Real ID.” This violates the “general welfare” clause of the Preamble, and while it might be construed as lawful under Article One, Section eight “regulate interstate commerce” clause, personal (ie non-business) travel by definition is NOT “commerce.” And one could reasonably argue that it violates the 1st Amendment right to peaceably assemble.
“Real ID” creates an illegal underclass for people who may simply want to be left alone and not have “Big Brother” constantly looking over their shoulders.
It is also the first step to communist-style “travel documents” to control the movement of the citizens of the US.
California also has some of the strictest gun control laws in the country. And in the aftermath of those four mass shootings, new House Speaker Kevin McCarthy — who represents a district in southern California — took the opportunity to poke at the state’s firearms restrictions, saying in a press conference that federal gun control legislation would not be an automatic response to these tragedies because such laws “apparently … did not work in this situation.”
So, did California’s gun laws succeed at making it one of the safest states … or did they fail to stop a string of mass shootings? Questions about the efficacy of gun laws have gotten easier to answer in recent years as changes to federal policy have helped to bring money and people back to the field of gun violence research. But decades of neglect mean there are still lots of blank spaces — policies that don’t yet have good quality data backing them up. A recent report from the Rand Corporation that reviewed the evidence behind a variety of gun policies found just three that were supported by evidence that met the report’s quality standards.1
That fact, however, doesn’t mean other gun laws don’t work — just that the research proving it doesn’t yet exist. Scientists I spoke to saw it as an “absence of evidence” problem, stemming from long-standing, intentional roadblocks in the path of gun violence research. Even the authors of the Rand report say lawmakers should still be putting policies aimed at preventing gun violence into practice now — regardless of what the science does or doesn’t say.
“I think that the goal of the lawmaker is to pick laws that they have a reasonable hope will be better than the status quo,” said Andrew Morral, a senior behavioral scientist at the Rand Corporation. “And there’s lots of ways of persuading oneself that that may be true, that don’t have to do with appealing to strict scientific evidence.”
California doesn’t just have some of the nation’s strictest gun laws and lowest gun death rates, it’s also maybe the best state to study gun laws in, said Dr. Garen Wintemute, director of the Violence Prevention Research Program at University of California, Davis Medical Center. That’s because of both the way the state makes data available to researchers and its willingness to work with researchers to further the science. Wintemute is currently part of a team that is working on a randomized controlled trial of one particular California gun law — an initiative that tracks legal gun owners over time and dispatches authorities to remove their weapons if those people later break a law or develop a condition that would make them ineligible to own guns in the state.
It’s hard to oversell what a big deal this is. Frequently referred to as the “gold standard” of evidence-based medicine, randomized controlled trials split participants randomly (natch) into groups of people who get the treatment and groups that don’t. Because of that, it’s easier for researchers to figure out if a medication is actually working — or if it just appears to be working because of some other factor the people in the study happen to share. These kinds of studies are crucial, but almost impossible to do with public policy because, after all, how often can you randomly apply a law?
But California has been willing to try. It took cooperation from many different levels of state leadership, Wintemute said. The government was always going to slowly expand this particular program statewide, but in this case legislators were willing to work with scientists and randomize that expansion across more than 1,000 communities, so that some randomly became part of the program earlier and some later. When the study finally concludes, researchers will be able to compare these two groups and see how joining the program affected gun violence in those places with a high level of confidence.
Most of the time, however, the scientists who study gun laws aren’t working with the kind of research methodology like this that produces strong results. Morral, along with his Rand colleague, economist Rosanna Smart, have reviewed the vast majority of the research on gun control policies done between 1995 and 2020. Their research synthesis found that a lot of what is out there are cross-sectional studies — observational research that basically just compares gun violence statistics at one point in time in a state that has a specific law to those in a state that doesn’t. That type of study is prone to mixing up correlation and causation, Smart said. There could be lots of reasons why California has lower rates of gun violence than Alabama, but studies like this don’t try to tease apart what’s going on. They end up being interpreted by the public as proof a law works when all they’ve really done is identified differences between states.
The Rand analysis threw out these kinds of studies and only looks at research that is, at least, quasi-experimental — studies that tracked changes in outcomes over time between comparison groups. Even then, the analysis ranked some studies as lower quality than others, based on factors such as how broadly the results could be applied. For instance, a study that only looked at the effects of minimum age requirements for gun ownership in one state would be ranked lower than a study that looked at those effects in every state where a law like that existed.
New York Gov. Kathy Hochul. (AP Photo/Yuki Iwamura)
Stand-your-ground laws “appear” to increase firearm homicides.
Following these rules, the Rand team found just three policies that have strong evidence supporting outcomes — and two of these are about the negative outcomes of policies that increase gun access. Stand-your-ground laws, which allow gun owners to use deadly force without trying to leave or deescalate a situation, appear to increase firearm homicides. Meanwhile, conceal-carry laws, which allow gun owners to carry a gun in public places, appear to increase the number of all homicides and increase the number of firearm homicides, specifically. The only laws restricting gun ownership that have this level of evidence behind them are child-access prevention laws, which have been shown to reduce firearm suicide, unintentional self-injuries and death, and homicides among young people.
That makes gun control laws seem flimsy, but it shouldn’t, Morral said. Instead, the lack of evidence ought to be understood as a product of political decisions that have taken the already challenging job of social science and made it even harder. The Dickey Amendment, first attached to the 1996 omnibus spending bill, for example, famously prevented the Centers for Disease Control and Prevention from funding gun violence studies for decades. A new interpretation of that amendment in 2018 changed that, but Dickey wasn’t the only thing making it hard to study gun violence.
Instead, the researchers told me, the biggest impediment to demonstrating whether gun control policies work is the way politicians have intentionally blocked access to the data that would be necessary to do that research.
“So for instance, the federal government has this massive, great survey of behavioral risk indicators that they do every year in every state,” Morral said. “And you can get fantastic information on Americans’ fruit juice consumption as a risk factor for diabetes. But you can’t get whether or not they own guns.” Not knowing gun ownership rates at the state level makes it hard to evaluate causality of some gun control policies, he explained. “And it’s not because anyone thinks [gun ownership] is not a risk factor for various outcomes. It’s because it’s guns.”
The missing data problem also includes the 2003 Tiahrt Amendment that prevents the sharing of data tracing the origins of guns used in crimes with researchers, said Cassandra Crifasi, co-director of the Center for Gun Violence Solutions at Johns Hopkins University. “So now all we can see are these sort of aggregate-level state statistics,” she said. “We can no longer look at things like, when a gun is recovered in a crime, was the purchaser the same person who was in possession of the gun at the time of the crime?”
Recently, researchers have even been missing basic crime data that used to be reported by the FBI’s Uniform Crime Reporting program. Law enforcement agencies and states were supposed to be shifting to the relatively new, much more detailed National Incident-Based Reporting System, but the transition has been a catastrophe, with some of the biggest law enforcement agencies in the country not yet making the switch because of financial and logistical complications, Smart said. “The FBI has not been able to report for the last eight quarters whether homicide rates are up or down,” Morral added.
But much of the data that’s not available at a national level is available in California, Wintemute said. “Unlike researchers in any other state, we have access to individual firearm purchaser records,” he told me — the very data the Tiahrt Amendment blocks at the national level. “We do studies involving 100,000 gun purchasers, individually known to us, and we follow them forward in time to look for evidence of criminal activity or death or whatever the outcome might be that we’re studying,” Wintemute said.
Unfortunately, because the data is only available in California, the results of those studies would only be applicable to California — making it data that wouldn’t be considered high-quality in the Rand report. Wintemute can demonstrate if a policy is working in his home state, but not whether it works in a big, broad, existential sense. It wouldn’t count towards expanding the number of policies Rand has found evidence to support. This is something researchers like Crifasi see as a flaw in the Rand analysis, but it’s also a reason why Morral and Smart don’t think the evidence-based policy is a good standard to apply to gun control to begin with.
It’s useful to know what there is evidence to support, Morral said. “But we don’t at all believe that legislation should rest on strong scientific evidence,” he said. Instead, the researchers from Rand described scientific evidence as a luxury that legislators don’t yet have.
“There’s always gonna be somebody who’s the first person to implement the law,” said Smart. “And they’re going to have to derive their decision based on theory and other considerations that are not empirical scientific evidence.”
Maggie Koerth is a senior science writer for FiveThirtyEight. Part of ABC.
Masanori Fukushima is an infectious disease expert and Professor Emeritus at Kyoto University — with over 25 years of oncology experience
Views: 25
“As a medical doctor and a scientist, I had no choice but to dare to take legal action.”
“Today, we filed a lawsuit against the Japanese government for cancellation of the administrative action,” announced Dr. Masanori Fukushima during a press conference on February 2, 2023. Because the Japanese Health Ministry refuses to acknowledge the causal link between vaccines and deaths, Professor Fukushima and a team of researchers said they “had no choice but to dare to take legal action.”
Masanori Fukushima is an infectious disease expert and Professor Emeritus at Kyoto University — with over 25 years of oncology experience. He has been hammering at the cracks in the vaccine narrative and publicly condemned Japan’s Ministry of Health late last year.
I have checked with a Japanese translator on the accuracy of the following text from the video translation, and he assessed it to be “actually pretty good.”
“Today, it is a matter of fundamental importance for the Japanese government to continuously collect and disclose accurate data,” Professor Fukushima expressed. “However, I have witnessed the recent fraud scandal committed by the Health Ministry.”
“I have come to realize that this is a historically serious problem that threatens the very existence of the nation of Japan,” he stressed. As a medical doctor and a scientist, I had no choice but to dare to take legal action.”
Dr. Fukushima continues, explaining the importance of honestly disclosing public health data.
“Needless to say, it is absolutely important to disclose real-world data on the efficacy and safety of the vaccination against the COVID-19 virus. This is because such data is directly linked to people’s healthcare, livelihood, and economy. Therefore, I believe that the Japanese government, that is, the Health Ministry, must disclose the data properly to the public.”
Professor Masanori Fukushima then breaks down some startling data. “Take a look at the data for 65-69 and 70-79 age groups,” he implored. “Surprisingly, the number of new infections or positive cases per 100,000 people is four times higher for people who have been vaccinated twice, compared to unvaccinated people.”
“Also, look at the data provided by the Advisory Board in September 2021,” he invited. “The fatality rate of the unvaccinated people and the fatality rates of the one-dose and two-dose vaccine people were described properly. According to the description in red, vaccination has indeed reduced the fatality rate for those over 65 years of age. However, for all ages, vaccination has demonstrated the opposite effect, causing higher fatality rates. This is a paradoxical phenomenon,” he asserted.
“As such, data on the fatality rates had already been published in official documents after all. However, in last year’s data, the Health Ministry deleted all that information,” Dr. Fukushima loathed.
“In fact, vaccination has been recommended based on the explanation that vaccination does not prevent infection, but vaccination prevents severe illness and reduces the mortality rate.” However,” Dr. Fukushima countered, “based on the data published by the Advisory Board in September 2021, the basis for recommending vaccination for all ages should no longer exist anymore. Despite the fact, the Health Ministry has pushed ahead with the vaccination.”
And as such, Professor Fukushima considers the situation to be “a serious national crisis.” “This is why I have decided to file a lawsuit against the government at this time.”
Adrian Monck served for over a decade as one of Klaus Schwab’s top deputies.
Adrian Monck, the managing editor and comms director of WEF, announced the news in a LinkedIn post. Monck oversaw the WEF’s notorious Young Global Leaders and Global Shapers programs, which Schwab infamously bragged had helped the outfit to “penetrate the cabinets” of foreign governments.
The World Economic Forum (WEF) and its benefactors continue to face major headwinds, as a global resistance has formed against the organization’s advocacy for a two-tiered feudalistic society. What was once a shadowy-by-design network has been forced into the mainstream spotlight, and the blowback to the WEF was on display for the world to see in its 2023 Davos conference.
The WEF’s extremist agenda, which advances tyrannical, anti-human narratives such as “The Great Reset” and “Build Back Better,” among others, met several unexpected challenges at Davos through independent and non-institutional media operations.
One Japanese journalist even got a few questions in with Schwab, who was incredibly displeased with this impromptu interview attempt.
我那覇真子 Masako Ganaha @ganaha_masako
I encountered Klaus Schwab! And here is what happened. He is afraid of our resistance! @ WEF Davos2023
In the United States, several Republican members of Congress even backed out of Davos after The Dossier reported on their planned participation in the confab.
The Dossier
Abandon Ship: Republicans in U.S. WEF delegation reverse course on Davos trip
Monday marked the first day of the World Economic Forum’s (WEF) annual confab in Davos, and the U.S. congressional to the ruling class gathering was noticeably slimmer than advertised.
274 likes · 105 comments · Jordan Schachtel
At Davos 2023, Monck cut a free promo for the Chinese Communist Party (CCP), to the expressed approval of the Chinese state media operations that were invited to the meeting.
Just weeks before its annual invite-only, closed-door gathering in Davos, Monck sought to mitigate the reputational damage to the WEF, churning out a series of articles claiming the outfit is the victim of “disinformation campaigns.”
In one such piece that was published in The Globe and Mail, Monck declares that “a Russian propaganda campaign” is to blame for people’s negative perception of the WEF.
“The intent was apparently to spread disinformation in a bid to stir far-right outrage about COVID-19 and perpetuate domestic extremism,” the retiring WEF comms chief rants. “The means was often via bots that would push far-right conspiracy theories to communities on boards such as 4chan.”
In calling for a global censorship and surveillance regime akin to the one installed by the Chinese government, Monck declared:
“The consequences of unabated misinformation are dangerous. Misinformation concerning COVID-19 and vaccines cost lives during the pandemic. The revelations around the Jan. 6, 2021, Capitol Hill riot reveal how false information about elections can threaten the foundations of democracy.”
Monck has not publicly revealed his plans for the future.
Davos Elites Cheer the Policies That Would Harm Those With the Least
By Chandre Dharma-wardana for Real Clear Markets
While eating caviar and sipping on fine wine, wealthy elites at the World Economic Forum (WEF) in Davos hobnobbed with an assortment of academics, government leaders, and environmental activists to discuss their plans for a global transition in agricultural production. They all agreed that the conventional practices now feeding the world need to be scrapped and replaced by organic-style farming, which they claimed would help fight climate change and make food systems more secure.
They emphasized tying aid to the world’s 600 million smallholder farmers with efforts to “encourage” the adoption of organic methods, which they described with all the familiar buzzwords, such as “regenerative” and “sustainable. But the new fashion is “agroecology,” which not only prohibits modern pesticides, synthetic fertilizers, and GMOs, but discourages mechanization as well.
One wonders if these entitled leaders took a momentary pause in their deliberations to consider the ongoing suffering and starvation in Sri Lanka, where past president Gotabhaya Rajapaksa took this kind of advice and bought into the fantasy of becoming the world’s first “fully organic and toxin free” nation.
Amid cheers from Davos-type eco-extremists, Rajapaksa proudly announced his plans at the 2021 Glasgow Climate Summit. Almost overnight, he banned agrochemicals and forced growers to adopt organic farming and become “in sync” with nature.
Shortly after in July 2022, Rajapaksa fled for his life amid mass protests and chaos as agricultural output dropped by 40%. Even today, more than 43% of children under five suffer from malnutrition there.
The Davos elites trumpet organic agriculture as the way to end food insecurity, even though it yields 35% less food per acre on average and could not possibly sustain the current population, let alone the almost 10 billion predicted by 2050. Their Swiss experts admit, and researchers confirm, that it cannot be scaled-up to feed even half the current world population.
In fact, every sustainability goal touted in Davos would be undermined by a shift to organic. Being 35% less productive means 50% more land needed to grow the same amount of food. Massively increasing farmland means cutting down forests and destroying habitat. That would devastate biodiversity and produce 50% to 70% more greenhouse gasses (GHGs).
Organic promoters should admit that organic farmers use lots of pesticides. They’re just older, less-targeted pesticides like copper sulfate, which are broadly toxic to humans and wildlife and must be used in greater amounts because they’re less effective.
Just weeks before the WEF at this year’s Conference of the Parties, a.k.a. the UN Convention on Climate Change in Egypt (COP27) and the UN Convention on Biological Diversity in Montreal (COP15), leaders were singing the same bad tune, calling for “regenerative agriculture,” “sustainable intensification” and the word on everyone’s lips: “agroecology.”
This cocktail of sustainability terms is just unsustainable peasant farming rebottled, and these efforts are the bastard children of policymakers infected with activist-fed misinformation.
It’s not just that more land is needed for organic. GHG emissions are increased because farmers must till (plow) fields or flood them to control weeds, rather than use modern herbicides. Replacing 100kg of synthetic fertilizer requires 2-3 tons of organic compost, and organic manures made from farm waste contain phyto-accumulated heavy-metal toxins from soils, promoting dangerous runoff.
Conventional agriculture tripled farmland productivity between 1948 and 2019. Globally, it boosted cereal production over 300%. Though the cognoscenti pretend otherwise, conventional agriculture has adopted many truly regenerative practices. In no-till agriculture, farmers use herbicides, like atrazine and glyphosate, to control weeds instead of machine tilling.
Yes, atrazine and glyphosate reduce erosion and create higher-quality soil. They also reduce CO2 emissions by 280,000 metric tons and save 588 million gallons of diesel annually—equivalent to the emissions of 1 million cars. And, no, these herbicides are not bad for people and the environment. Atrazine does not leach into groundwater, as Health Canada showed in response to EU’s atrazine ban; and glyphosate does not cause cancer, as evidenced by the world’s largest and longest health study.
The wealthy elites steering the WEF and COP could make progress toward their laudable goals if they base their policies on such demonstrable facts, rather than fashionable organic fantasies.
Replacing 100kg of synthetic fertilizer requires 2-3 tons of organic compost, and organic manures made from farm waste contain phyto-accumulated heavy-metal toxins
Yet the pseudo-ecology haunting COP27, COP15, Davos and the EU channels the planet’s food security, biodiversity, and GHG mitigation efforts toward disaster, as Sri Lanka could attest.
So these leaders fly home on their greenhouse-gas-emitting jets, unaware or uncaring about the human and environmental damage their policies are promoting.
Now we know why there’s a HIGHWAY to HELL but only a STAIRWAY to HEAVEN.
The United Nations is releasing a report in June regarding the “perceived contradictions” between religious freedom and sexual orientation and gender identity, or SOGI, laws and is looking to push governments to “fully comply with their obligations under international human rights law to protect and empower LGBT+ persons,” according to a U.N. announcement.
The U.N. closed a call for LGBT and religious freedom organizations to submit input to the report earlier this month and is scheduled to introduce its findings at the 53rd Human Rights Council meeting in June, according to the announcement.
The announcement explains that while there are “perceived contradictions” between the LGBT community and religious freedom, the report aims to find ways to “protect LGBT+ persons’ access to faith and spirituality” while also indicating that religious beliefs that would contradict this are not “justified” under the protection of human rights.
“Religious and spiritual narratives have also historically been used to promote, enable, and condone institutional and personal violence and discrimination against individuals based on sexual orientation or gender identity (real or presumed); repress sexual and gender diversity; and promote cis-gendered and heteronormative norms of sexual orientation and gender identity,” the announcement read.
“These practices cannot be justified under the rubric of Freedom of Religious Beliefs, or indeed any other human right, to circumvent and defeat the rights of marginalized populations.”
he person in charge of the special report is Victor Madrigal-Borloz, an expert on protection against violence and discrimination based on sexual orientation and gender identity and a professor at Harvard Law School. Madrigal-Borloz has long been an LGBT advocate and recently welcomed Pope Francis’ declaration that homosexuality is “not a crime,” despite the pontiff’s further clarification that in religious circles it is still considered sinful.
Any organization that wished to comment for the inquiry was tasked with keeping their comments to a minimum of 2,5000 words and providing answers to 11 questions on religious freedom and the rights of the LGBT community, according to the announcement.
Respondents were asked whether or not any religious beliefs and LGBT rights were “mutually exclusive,” to point out policies that protect discriminatory religious practices and about the extent to which religious individuals have the right to a conscientious objection.
The U.N. didn’t disclose who commented ahead of the report’s release, but two organizations publicly published their comments for the inquiry, focusing on their concerns about the impact on the religious community. The Religious Freedom Institute and the Heritage Foundation’s comments worried that the special inquiry would “undermine” and result in the “politicization” of religious freedom as a human right.
“My biggest concern is the premise of the report which seems to suggest that freedom of religion and rights based on sexual orientation are the same,” Grace Melton, senior associate in the Richard and Helen DeVos Center for Life, Religion, and Family at Heritage, told the Daily Caller News Foundation.
“But certainly as a function of international law, they are not the same. Freedom of religion or belief, or freedom of conscience, is an internationally protected human right. It’s codified in the International Covenant on Civil and Political Rights, which is a legally binding treaty.”
Melton further explained that she was “not terribly optimistic” that Madrigal-Borloz shared her views on the subject and warned that both domestic and international laws have become more and more antagonistic toward those who openly express their religious beliefs.
“Increasingly the U.S. has seen international law or U.N. opinions inform our own judicial opinions or even our own laws, regardless of whether or not that’s what the Founders intended,” Melton said. “So from the outset, to conflate those two things is concerning from somebody who is supposed to be a human rights expert.”
Andrea Picciotti-Bayer, a fellow for the Institute for Human Ecology at the Catholic University of America, told the DCNF that she had similar worries, calling the report a “bold attack” and an attempt to try and “walk back the special protection” afforded to those with sincerely held religious beliefs.
“Despite saying that we shouldn’t have these rights pitted against one another, but when you keep reading on you see that the author of the report really does see [rights and religion] as being in conflict,” Picciotti-Bayer said.
“I think it’s important that the foundation of the question of human rights is that these are universally shared rights, that we share not by nature of any affinities but because of our humanity and the right to religious freedom … that’s a right that each and every human being possesses.”
Picciotti-Bayer said that efforts like the one from the U.N. are based on a “narrative” that “religion is an oppressor and that religious freedom can be weaponized to harm others.”
“This narrative is not only harmful because it could make people doubt the importance of religion in their own lives and their communities, but it’s also harmful because it will undermine really important social protection. Religion and religious freedom is a stabilizing presence, and for the cases where religion is being misused to oppress, the answer isn’t to shut down religion entirely.”
Side effects include a multitude of things the shot should NOT be doing.
Views: 31
That means that over 40 million women in the United States have had their menstrual cycles affected by the C19 jab.
Project Veritas released another breaking story last night (Feb. 2) featuring Pfizer executive Jordan Trishton Walker. This time, he was caught on camera openly admitting concern about women’s cycles and their fertility. As a result, #Pfertility is trending on Twitter.
BREAKING: @Pfizer Director Concerned Over Women's Reproductive Heath After COVID-19 Vaccinations
"There is something irregular about their menstrual cycles...concerning...The vaccine shouldn't be interfering with that...It has to be affecting something hormonal..."#Pfertilitypic.twitter.com/XAuMPJNShD
In light of Project Veritas’ latest bombshell, we have compiled an array of respected voices speaking out about menstrual and fertility concerns. Doctors, scientists, thought leaders, and women across the globe have been screaming from the rooftops on this subject for years now.
(In the interest of brevity, I’ll just post the videos from Vigalent Fox [there are quite a few]. The full article, with Twitter comments, can be found HERE , Some may be out of order —TPR)
Basically, Pfizer knew that there would be problems, they knew that lipid nanoparticles such as in the clot shot accumulated in the ovaries, and Bill Gates (bless his heart) was studying ways to interfere with reproduction.
Scene from the Dexter TV show, for illustrative purposes
Views: 33
First, let’s define what we mean by “most dangerous” because there are many different “most dangerous” lists out there. Here we are talking about the overall crime rate. Not just the violent crimes that grab headlines. and the list we are using is a live database that is constantly being updated.
For instance, according to WorldAtlas.com St Louis, MO is the 7th most dangerous in the world based on the murder rate per 100k. It is a democrat-run city.(Tishaura Jones). The first six are all in Mexico.
OTOH, The Boutique Adventurer drops St. Louis to #10 with 8 of the 9 above it in Mexico — the ninth being Caracas, Venezuela at #6. Baltimore comes in at #15, the same as on our main database. New Orleans is at #18 and Memphis at #20 while Detroit clocks in at #26.
Curiously, this one doesn’t list ANY US cities in their top 27.
These, like the one I’ll devote the rest of this article to are listed as being compiled in(or for) 2023.
DANGER!
Eleven U.S. cities rank among the 50 most dangerous in the world, according to a recent reportpublished by Numbeo, a global quality of life database. All 11 are governed by Democratic mayors.
Three U.S. cities — Baltimore, Memphis, and Detroit — are ranked among the 20 most dangerous cities on the planet.
The three cities have more in common than just violent crime. All three are run by Democrats.
Baltimore ranks #15 on the annual dangerous cities list, with Memphis and Detroit close behind at #18 and #19, respectively.
Brandon Scott, just 38 years of age, is the mayor of Baltimore. Jim Strickland Jr., an attorney and politician, is the 64th and current mayor of Memphis, where the Memphis police department has just announced plans to permanently deactivate the unit that five of the officers involved in the vicious beating of Tyre Nichols belonged to. Mike Duggan, meanwhile, is currently serving as the mayor of Detroit.
Two more U.S. cities run by Democrats appear among the 30 most dangerous in the world: Albuquerque (#23), where 45-year-old Tim Keller serves as the 30th mayor, and St. Louis (#27), where Tishaura Oneda Jones has served as mayor since April of 2021.
Tracking back for a wider view yields a still grimmer perspective for Democrats, as another six Democrat-run cities rank among the world’s 50 most dangerous: New Orleans (#35), Oakland (#38), Milwaukee (#40), Chicago (#43), Philadelphia (#46), and Houston (#50). Again, all of these cities are run by Democrats.
Numbeo’s report contains both a Crime Index, which is an estimation of overall levels of crime in a given city, and a Safety index. A city with a high safety index is considered very safe. A city with a high crime index is considered anything but. If a city’s crime levels are lower than 20, for instance, this is considered excellent. Crime levels between 20 and 40 are considered good; crime levels between 40 and 60 are moderate; crime levels between 60 and 80 are considered high. Finally, crime levels higher than 80 are considered dangerously high.
The Safety Index, meanwhile, is ranked in the completely opposite way, with scores higher than 80 indicating that a city is very safe, and scores under 20 indicating that a city is borderline uninhabitable.
Baltimore has a Crime Index score of 75.5 and a Safety Index score of 24.5. “Charm City” finds itself sandwiched between Port of Spain, the capital of Trinidad and Tobago, and Rosario, Argentina’s third-most populous city.
In 2019, then-U.S. Attorney General William Barr referred to Baltimore as the country’s “robbery capital.” Although the comment was deemed controversial by some commentators, it is amply substantiated by crime statistics. Last year, the city of 576,000 experienced a sharp spike in robberies, with robberies of convenience stores jumping by 300%. Baltimore also suffered a sharp increase in homicides.
Some 900 miles away, in Memphis, overall crime increased by more than 8% last year. By August of 2022, 4,501 crimes had been reported in the downtown area of the city, 600 more than had been reported by August of 2021, according to the city’s Data Hub.
In Detroit, more than 220 officers left the police department last year. Long known as the automobile capital of the world, Detroit has, in recent times, become more closely associated with assaults, shootings and homicides. On New Year’s Day, for instance, a total of 6 people were shot, one of them fatally. Five days later, a 16-year-old was killed and an 11-year-old was injured in yet another shooting.
Democrats have often been labeled “soft on crime” by their opponents. The latest Numbeo report will do little to stem such denunciations.
Here is an abbreviated list from the Numbeo list linked above:
BY Steve Kirsch Founder, Vaccine Safety Research Foundation (vacsafety.org) Updated 1/31/23
If the CDC was honest, this is what their new ads should look like!
If the CDC was honest, this is what their new ads should look like!
Using a novel analysis technique, anyone can now prove that there is no longer any doubt that the vaccines are SHORTENING the lifespans of EVERYONE who takes them. They should be immediately stopped.
Update at 12pm PST 1/31/23
This critique is convincing, but wrong. If everyone was last vaccinated just 10 days before the end of 2022, it would still be a .5 ratio if the vaccines were perfectly safe because the death rate in the final 10 days would be spread evenly over time.
I realized I made an error in some of the formulas so I’m re-doing the numbers.
Also, because the unvaxxed transition to the vaccinated, there are fewer unvaccinated to die in later months so there will be fewer unvaccinated deaths which will skew the ratio for the vaccinated to be lower than .5.
I’m currently using the date of last vaccination as the starting point and I believe it may be more correct to use the date of first vaccination. Still mulling that over.
Executive summary
This is the most important article I have ever written in my life.
It shows a novel method that anyone can use to prove that the COVID vaccines are leading to premature death in anyone who takes them, no matter what age. So you don’t have to believe me. You can collect the data yourself and do the same analysis I did. It’s very easy. It took me about an hour to collect the data and analyze it.
The methodology is both technically sound and objective. Anyone can collect their own data including any state in the US and many foreign governments. I predict no one will look. That tells you everything you need to know.
I asked UK Professor Norman Fenton to critique the method I used here. More about him in the text below. Bottom line: he loved the method I used (which he hadn’t seen before), he validated the calculations in the figure below, and he wasn’t aware of any way the conclusion could be legitimately challenged. There are always all sorts of hand-waving arguments such as “your study wasn’t IRB approved” or “your study is unethical because you are looking at deaths from the COVID vaccine” but they are just that: hand-waving.
To further prove my article cannot be challenged, I am pioneering a unique approach to that as well that is fair, thorough, and transparent. I’m publicly offering 10X your wager to anyone who believes that the data actually shows the opposite of what I claimed. See details of the offer in the text below. If you think I got it wrong, you can turn $25K into $250K in days!
This article describes how a simple objective analysis of objective death data (age, date died, date of last COVID vaccination) can be used to prove beyond a reasonable doubt that the COVID vaccines are shortening lifespans and should be immediately halted.
This explains why all the world’s health authorities are keeping their data secret; their data would reveal that all world governments have been killing millions of people worldwide. No government wants that disclosed. They won’t debate me on this. They will try to censor this article because they can’t hide from the truth. Or they will try to create FUD by arguing the survey is biased without describing the bias.
I predict that this article will be ignored by the mainstream press and the medical community. The longer they ignore me, the worse it will look for them. The first rule of holes is that when you find yourself in a hole, stop digging.
Unless there is a serious error in my methodology or someone can explain precisely how surveying “my followers” creates a biased sample that shifts the numbers for the vaccinated or shows us a more comprehensive, trustable data set, the game is now over.
If the vaccines are safe, the CDC should have produced this analysis using statewide data long ago. It is trivial to do. Why didn’t they? The answer is simple: because they know it would blow the narrative and prove to the world that they are incompetent fools.
If you want to prove me wrong, let’s get the statewide data from all states and make it public. All we need is Age, date of death, date of last COVID vaccine. That does not violate HIPAA or a dead person’s privacy because there is no PII.
But states will refuse to release that data because they know if they did, they are finished.
So in the meantime, they will say, “Your survey is biased.” But nobody can explain the “bias” that explains the result because my readers DO NOT CONTROL THE DATE THAT THEIR FRIENDS WERE VACCINATED, their age, or the DATE they died.
My readers may be more affluent than the average American so that’s a bias. But if the vaccine is killing affluent people, we have a problem. My readers might be more intelligent than the average American, so that’s a bias. They may have more intelligent friends. So this survey, it could be argued, just shows that intelligent people are being killed by the vaccine. That SHOULD be a stopping condition.
Or you could argue that my readers are less intelligent than the average person. And once again, unless you are trying to cull a society, that should be a stopping condition as unethical.
ANYONE CAN REPLICATE MY SURVEY if you think it is “biased.” The New York Times could replicate my survey and prove I’m wrong.
But they won’t.
And that tells you everything you need to know, doesn’t it?
If they want to argue with this article, THEY need to show us THEIR data and not engage in hand-waving arguments to create FUD that have no evidentiary basis.
The game is over. We have won. You cannot hide from the truth any longer.
We’ll see if anyone wants to challenge this article and get paid 10X their wager if they are right. Bring it on!
In this article, I show a clever new method for analyzing the death/vax records that is simple and objective; it relies on just a simple division of two time measurements.
The survey
A month ago, on December 25, 2022, I announced the survey below.
The survey asked people if they knew anyone who died in 2020, 2021, or 2022.
If they did know someone, simply report objective facts about the death: age, date died, and if vaccinated, the date most recently vaccinated.
If people knew >1 person who died in the period, just report the person whose details you are most familiar with (e.g., family member vs. friend).
As of January 29, 2023, I received 1,634 responses. The analysis here looks at the responses.
We only consider OBJECTIVE data and our analysis is OBJECTIVE. It’s all math.
If the vaccines are causing death, the analysis will pick it up.
Methodology
The analysis is done by looking at “days in category before death” divided by “days possible in category if you had lived to the end of the observation period.”
We do this for both vaxxed and unvaxxed people… across all ages, and also in various age ranges which I arbitrarily chose. You can choose your own if you don’t like the age categories I chose. It won’t change the result.
Here’s how the method works (credit to Clare Craig who suggested this wording):
Imagine a timeline for 2021 and 2022. For the unvaccinated we would expect an even distribution of deaths over time except for seasonal differences. For each person, we can compare how long they did live in that period with how long they could have lived. A few who died early would have lived for only a tiny fraction of their potential and a few that died late for a large fraction. However, most will be in between and the mean will be 0.5.
For the vaccinated, we start the clock on their date of their last vaccine. The timeline will therefore vary for each person but with a harmless vaccine we would still expect exactly the same distribution – a few early, a few late and most in the middle with a mean of 0.5.
If the vaccine killed people we would end up with more deaths early on. The mean ratio of life lived compared with life that could have been lived will fall below .5.
Given ratio=((time in category)/(time possible in category)) and knowing that the person died sometime in Jan 2021-Dec 2022, we have:
If the intervention (i.e., the vax) does nothing, ratio = .5
If the invention shortens life, ratio <.5
If the intervention increases lifespan, ratio > .5
It’s that simple. The important thing is that the ratio tells us if the intervention is helpful, neutral, or harmful.
The analysis is independent of the rates people die. The fact that older people die faster than younger people is immaterial. Pre-existing conditions, etc. do not matter.
There is an argument to be made that people who got vaccinated first were more vulnerable and were more likely to die, and thus the rate in a category changes over time, but that effect isn’t very large. I’ve run the numbers for those who died and were last vaccinated in 2022 and the numbers are all less than .5. You are welcome to prove me wrong, but you’ll need to do it with evidence, i.e., actual queries and not hand-waving arguments. Numbers talk.
To date, everyone who thinks they can debunk this has produced only handwaving arguments and no analysis.
Sorry, but that’s not very convincing.
Limitations
My survey includes reporters from all over the world, but all the readers speak English and 70% are in the US. The data can be analyzed just for the US and for specific vaccines as well, but below I include all the records to show that I’m not cherry picking and also to get more stability in the numbers (fewer data points creates more noise).
The people who answered are my followers and are most unvaccinated themselves. They are reporting deaths of the person they know the best, whether vaxxed or unvaxxed. I invite fact checkers to validate that people were true to the direction they were given. There are more vaccinated deaths reported simply because 75% of the US population is vaccinated.
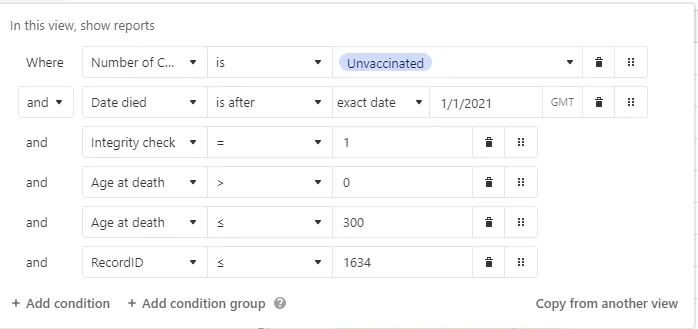
The percentage of unvaccinated to total deaths was 29% (222/(222+542)).
So you might think “Ah ha! That proves that the unvaxxed are dying at a higher rate than the vaxxed because it should be only 25% of the deaths that should be vaccinated so this PROVES the vaccines are saving lives!”
No, it just proves that unvaccinated people hang around other unvaxxed people and are slightly more likely to report their deaths.
This is very helpful for our survey for two big reasons:
It gives us enough data in both the vaxxed and unvaxxed buckets so we can do meaningful comparisons between the two buckets
I can’t be accused of bias, e.g., you anti-vaxxers are just reporting vaccinated deaths to make the vax look bad. Clearly this isn’t the case… they are reporting disproportionately more unvaccinated deaths. So it looks very credible because it’s consistent with what you expect to see.
Note that the mix of vaxxed/unvaxxed deaths is immaterial to this analysis. Each cohort is examined independently. If I had 50% vaxxed and 50% unvaxxed deaths, the results would be exactly the same.
It’s important to note that my followers cannot determine the date of death of unvaccinated or vaccinated individuals (unless they have God-like powers). And I have contact info for all the records so they can be “spot checked” to validate that people followed my instructions to report the person they are most familiar with.
There is a recall bias in that people are more likely to report deaths that happened more recently. This shifts the average death time to the right. This is why unvaxxed are > .5 (more about that later).
For vaccinated people, there is also a healthy patient bias. If you are going to die in days due to a fatal cancer, most people would not get vaccinated.
There is some amount of seasonality in deaths that might skew things somewhat. It’s minimal for those <60, and small for the elderly. But we’re looking at a 2 year period so it shouldn’t be much different between vaxxed and unvaxxed.
Gaming
It wasn’t possible to game the survey because nobody, including myself, knew how I was going to analyze the data until after the data was collected.
There was one person who put in a bogus entry (record #260) but that was easily spotted and removed.
The analysis cut off time was before this article was written so anyone trying to pollute the data will be unsuccessful since any new records aren’t included in the analysis.
Transparency
The database has been in public view the entire time that the data has been gathered. When a record is submitted, it appears in the public view.
Verifications
No submissions were deleted (other than record 260 which was clearly gamed) or modified which can be verified by the changelog of the data. The database is hosted by a third party firm.
There is an “integrity check” field indicating which records passed simply sanity check such as date vaccinated < date died. Only those records were processed.
I have the contact information for each reporter. I am looking forward to being contacted by any mainstream “fact check” organization who is willing to be recorded on video as we discuss the article. I’m happy to supply contact info for any line(s) in the survey so the fact checker can verify every record is legitimate.
Expectations
People who die within 2021 to 2022 should be expected to die evenly throughout the period (there is some seasonality so it isn’t flat over the calendar months). Therefore, with no biases, we’d expect that the average days of life is 1 year in any 2 year observation period. So a ratio of .5. The seasonality cancels out.
But due to recall bias (since we are asking people to recall deaths rather than using government records), we’d expect the number to be skewed to dying more recently so maybe we’d see a ratio of .55 for the unvaccinated.
The vaccinated benefit from both recall bias and the healthy patient bias, so it might be .58 or more.
If the vaccines are safe and effective, the ratio of the vaccinated > ratio of the unvaccinated due to the healthy patient bias.
If the vaccines are killing people, the ratio of the vaccinated <= ratio of the unvaccinated (since the healthy patient bias would give the vaccinated an advantage).
If the vaccines are killing people, the ratio will be <0.5.
The ratio for the vaccinated is .31 or less for every age range with > 5 records.
For the unvaccinated, the ratios are .52 or better for every age range with >5 records
The data is remarkably consistent when there are enough records for the range (generally 10 or more records per the uV# or V # columns).
The values in red are unreliable due to a lack of sufficient data points.
Values in red have too few records to compute an accurate ratio. Ratios >.5 are expected for a safe intervention. Ratios <.5 mean something is killing these people prematurely.
For the unvaccinated, my Airtable filter looked like this and I used the unVaxxed days alive/days possible columns:
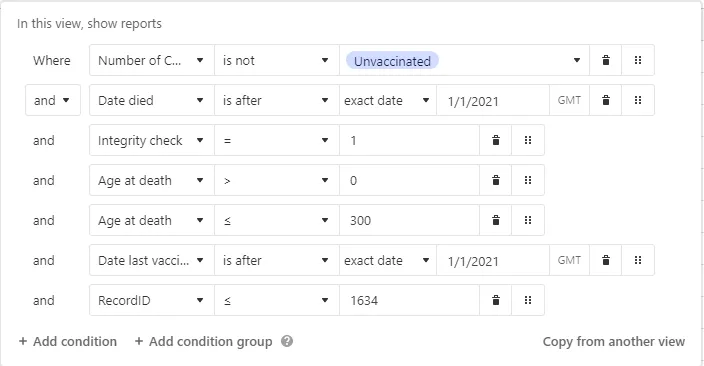
For the vaccinated, my Airtable filter looked like this and I used the Vaxxed days died/days available columns.
NOTE: The “Integrity check” is NOT complete. But when coupled with the restrictions of the two filtering conditions, invalid records are all filtered out of the final result.
inal result.
Is my analysis wrong?
This is an Occam’s razor analysis. You could get fancier but it wouldn’t change the result. The signal is very very strong that the vaccines should be immediately stopped.
If I have made a mistake, I’d be grateful to see the correct analysis of the data using the same methodology. So if you object, show us the proper analysis.
The data is remarkably consistent for each age range. But there is a huge difference between the vaxxed (.3) and the unvaxxed (.58). This is exactly what I expected to see; no surprises. But it’s IMPOSSIBLE for the blue-pilled medical community to explain how this could possibly happen if the vaccine is so safe since it was supposed to be the other way around.
A simple look at the Notes field confirms the role of the vaccine in these deaths. That’s subjective proof. It shows that the vaccines are not as safe as claimed.
As far as confidence intervals, the numbers are remarkably consistent so the confidence intervals appear to be small. I’ve asked Professor Fenton for the correct way to ascertain these. He’s thinking about it. I’ll update this when I hear back.
But there’s more confirmation…
Failure anecdotes » success anecdotes
Is this analysis consistent with reliable evidence? Yes.
As it turns out, it’s easy to find failure anecdotes for the COVID vaccines. The anecdotes we generally find show STRONG failures.
By contrast, it is nearly impossible to find a “success anecdote,” even a weak success. I always ask doctors who will talk to me and they’ve never mentioned a single success story. I do this constantly on Twitter Spaces in full public view and NONE of the DOCTORS will EVER be able to cite an example. In fact, I have not found any medical doctor who has ever been able to cite a single geriatric practice or nursing home where deaths dropped after the vaccines rolled out.
If the vaccines were saving lives, there should be THOUSANDS of “poster elderly” success stories, yet there are none. All the anecdotes are strongly negative. That’s simply impossible if the vaccines are saving “tens of millions of lives” as Neil deGrasse Tyson said on YouTube. When I called Neil to ask him for a success anecdote, he hung up the phone on me.
So we have a pretty good sense just from the failure to find a success that the vaccines are an utter disaster. We didn’t even need to do any numerical calculations!
Lots of things confirm our hypothesis:
Lack of success anecdotes, but failure anecdotes easy to find
People switch from pro- to anti- but not the reverse.
Nobody can explain the 15,000 excess deaths in VAERS for the COVID vaccines. It’s not there for other vaccines, the deaths are all consistent with vaccine deaths. What killed all these people if it wasn’t the vaccine?
Ed Dowd’s book “Cause Unknown” contains tons of data. Where is the document debunking everything in that book and showing the cause of all these deaths, especially the increase in child deaths happening right after the vaccines rolled out for kids.
What about the 770 safety signals in VAERS. Why didn’t the CDC tell anyone about any of those signals? They notified the public about the VSD signal for stroke and didn’t even mention that it also triggered in VAERS.
Geriatric practice: I finally found a large geriatric practice of 1,000 patients, 75% are over 65. Their normal death rate is 11 per year (the mean). In 2022, they had 39 deaths for the entire year. They attribute the 28 excess deaths to the vaccine. If it wasn’t the vaccine, someone needs to explain to us what is killing these people because whatever it is, it needs to be IMMEDIATELY stopped. They can’t go public for fear of retribution.
Savo Island Cooperative (Berkeley, CA): Roughly 150 people. No deaths for 5 years before COVID; 0 in 2020; 1 in 2021; 3 in 2022 and they were all vaccinated and boosted (plus 3 strokes and 4 heart attacks). Reported to me by Jane Stillwater last night at an event I spoke at. Nobody at the event could recall any success anecdotes.
Ed Dowd mentioned the vaccines have killed 800K Americans and disabled 4X as many as killed, 3.2M since the vaccine program began.
The peer-reviewed scientific literature published a paper by Mark Skidmore showing over 217,000 deaths in 2021 alone due to the COVID vaccine. But they are looking at retracting the paper because Mark didn’t include a full bio on one of the funders of the study. Also, he asked a question about deaths from the COVID vaccine and that’s unethical (COVID virus questions are OK and ethical).
Josh Stirling looked at how cities in the US did in 2022 vs. 2021. So it’s a longitudinal study where you compare the city with itself one year ago. This is the best way to see what is going on… did your mortality increase or decrease. Check this out: cities with higher vaccination had larger all-cause mortality increases than cities with lower vaccination rates. In other words, the line goes the “wrong way.” This is devastating for the narrative, but of course consistent with what the death reports are saying. The R2 doesn’t need to be .9 for this to be convincing. They are correlated and it’s the slope of the line that is significant. The slope is the wrong way. That’s the point.
US cities; all ages; compare 2022 vs. 2021 in the same city The line slopes up. In other words, the experts were completely wrong: the vaccines are deadly. This is very compelling proof of harm that is impossible for anyone to explain away with a straight face. When combined with this analysis, it’s not credible to keep claiming the vaccines are safe and effective.
NOTE: The summary and challenge to prove Steve Kirsh’s analysis wrong is at least as long as what is above. As of the 1/31 update, an error had been discovered and he is re-working against the same data. But he is still challenging Big Pharma and their deep state partners to prove his conclusions wrong and show how they got THEIR numbers.


 162
162


 See full article